Diving into CellMax’s data from ASCO GI 2018 on colorectal cancer detection by CTCs
Circulating tumor cells: potential biomarker for CRC?
While writing my post about ASCO GI 2019 (in particular, the section on CellMax’s new abstract), I realized that to tell the story properly, I had to analyze last year’s CellMax data. That turned into enough content that I thought it would be best to split it into a separate post, so here we are.
Disclaimer: As with everything else on this blog, opinions expressed here are my own, and not those of any past, present, future, or subjunctive employers.
CTCs for CRC? CellMax @ ASCO GI 2018
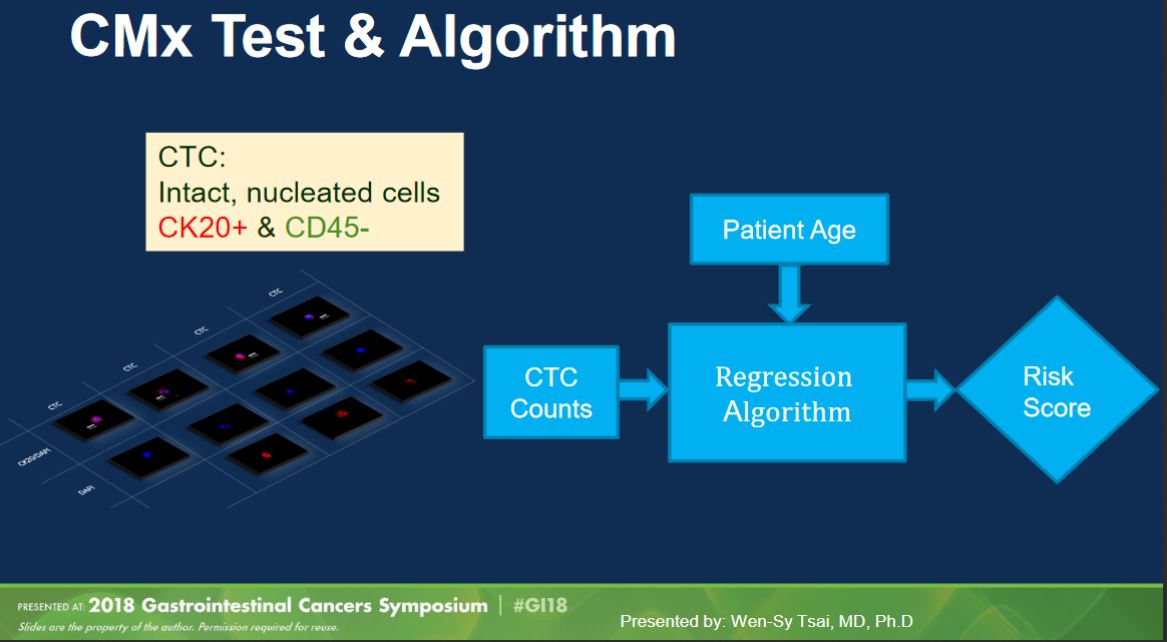
CellMax Life made a splash last year at ASCO GI 2018 with a platform talk (abstract, slides) presenting results from their study of 620 samples (“prospective and multi-year”). Their test as presented last year used their CMx platform to pull out “circulating tumor cells” (defined as intact, nucleated CK20+/CD45- cells) and combined cell count with age to produce a test score.
(Aside: in my opinion “circulating tumor cell” is a bad name. There is no consistency in definition in the field, so you always have to check how a particular paper defines a CTC, whether it’s based on EPCAM, CK20, mechanical properties, or some other way. These inconsistent definitions underscore the lack of assurance that a given “CTC” actually came from a tumor, as might be implied by the name.)
The method generated a lot of interest, with claimed performance of 86.9% sensitivity for CRC and 76.6% sensitivity for “pre-cancerous lesions” (adenomas, advanced adenomas, and stage 0 carcinomas) at specificity of 97.3%. If these numbers were to hold, they would be quite a lot better than other published non-invasive testing options.
Although I wasn’t at the presentation last year (I only reviewed the slides shared after the fact), I had a number of concerns about the method and results presented that made me unsure whether to buy the top-line numbers.
Question 1: The “Age-Adjusted Model”, or confounds are hard to model correctly
Age is a well-known confounder in cancer detection projects: the older you are, the more likely you are to have cancer. Samples from healthy patients thus tend to be from younger people than samples from cancer patients. This means that a marker that is causally determined by age, rather than by cancer status, may look like it detects cancer. This isn’t necessarily a bad thing: if someone is older, then it makes sense to adjust upwards your prior that they have cancer (in a Bayesian sense). However, that is not the same as including age as a factor in your model; unless the distribution of ages in your cases and your controls matches the distribution of cases and healthies in the intended screening population, you will create a biased model. (Think about it this way: if the distributions differ, then your model will learn an age effect that is either too strong (more likely) or weaker than it actually is in the general population.) We don’t have much information about either the distributions of ages in the CellMax sample set, nor how they approached the statistical modeling. What we know is that the range of ages in the cancer set was skewed upwards (from slide 10):
| Status | Number of Samples | Age Range |
|---|---|---|
| Control (Healthy) | 182 | 20 - 80 |
| Pre-Cancer | 111 | 20 - 81 |
| Cancer | 327 | 31 - 87 |
The bottom of slide 11 suggests that the statistical model is simply logistic regression on two parameters: CTC number and age. Since we don’t have details on the distributions, we don’t know exactly how much power is coming from age alone. Unfortunately, while they did show the results of removing age from the model (i.e., CTCs only), they did not show the results of removing CTCs from the model (i.e., classifying on age alone):
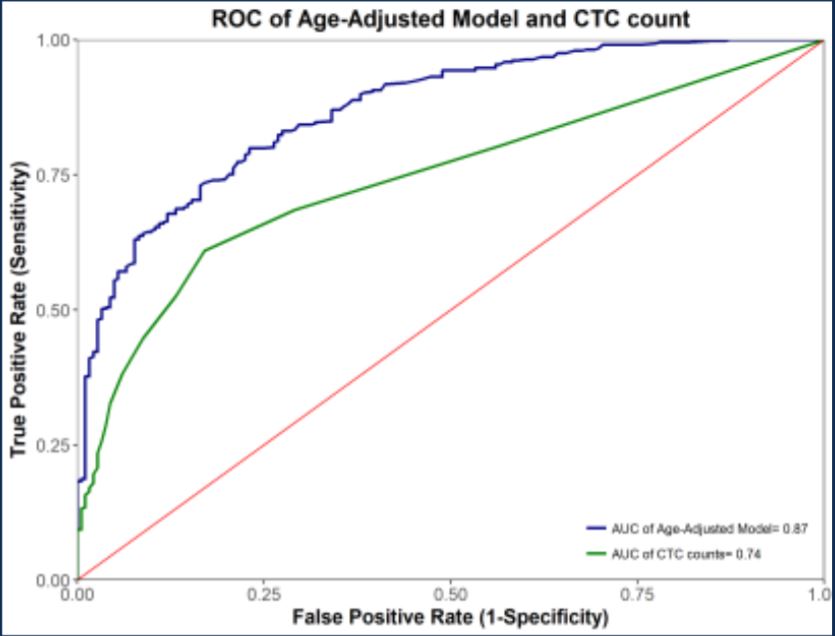 ROC for precancerous + cancerous lesions combined
It might be the case (again, we don’t have enough data shown to know) that age alone may be enough to distinguish most cases from most controls. If the count of CTCs is correlated with age, then it might be the case that CTC count is a weak predictor of age, which suffices to get most of the classification power you need. In fact, we know that there must be significant age bias in the sample set, because adding age as a parameter improves the performance (blue trace above).
Question 2: Train/Test separation (or the lack thereof)
One thing that is nowhere made clear in the talk is exactly how the performance numbers are obtained from the fixed data set. (Again, in all fairness, this may have been mentioned orally but not in the slides; seems like something you’d want to say, though.) It would be valid to train a classifier system (here, logistic regression on two parameters) on a discovery set and then to report the performance of this fixed model on an independent validation set. It would also be valid (though less rigorous) to report the performance of this classification scheme in cross-validation (k-fold, leave-one-out, etc.; with this few parameters and this many samples, I would tend towards k-fold with small k), as in cross-validation you always train and test on different samples. However, neither a validation set nor cross-validation are anywhere mentioned in the slides. I’ve seen this anti-pattern in many clinical presentations before, and it has typically meant that validation numbers were computed on the discovery set, or put a different way, testing on the training set. If this is what happened, it calls the results into real question; good performance on the training set is both expected and more-or-less meaningless.
Question 3: Inclusion and recruitment criteria for study subjects
The study is described as a “prospective” study; i.e., one that drew fresh samples, not one that took archived samples from a biobank. This is likely a prerequisite for the method, as biobanked blood is probably much less likely to contain intact or viable cells for their CMx method. While this is prospective, this was almost certainly not conducted in a way to mirror the “intended use population” (the distribution of individuals who would be tested in a screening context). Two things stand out to me:
-
Slide 8 states in a footnote that “some control samples were from self-declared healthy subjects” (whereas others were colonoscopy-confirmed, suggesting that samples were not uniformly collected across the study and there may be multiple different populations involved. (It also calls into question whether all the healthies were in fact healthy, but even adenomas should not be that common.)
-
The study population had 327 cancer cases at stage I or greater compared to 182 healthy samples and 111 pre-cancerous samples. In a general screening population, we might expect around 1/150 patients to have colorectal cancer (65 cancers out of 9989 IUP samples in Imperiale 2014); here we have 327 out of 620 — more than half of the samples. This implies that the cohort was somehow enriched for cancer patients.
There are at least a couple ways to enrich. Rejection sampling would be valid but very expensive: enroll a LOT of patients blindly, keep all the patients who had cancer, and reject (ignore) a large portion of the healthies. To do this, assuming the statistics from Imperiale et al hold up, you’d need to enroll close to 60,000 patients. This is probably not what happened. You could enroll patients from high-risk cohorts (for CRC, those with Lynch syndrome), but that probably doesn’t get you 100-fold enrichment. A common way to enrich in such a study would be to take patients who already have a diagnosis of cancer (e.g., by colonoscopy), and bring them back for a blood draw. This way, you don’t oversample healthies, who are easy to find just by testing the general population. However, there’s no guarantee that patients who have already been diagnosed have the same distribution of your biomarker as those pre-diagnosis, who are the ones you’re actually trying to find. For example, if the cases in this study were selected because they had previously had a positive stool test or colonoscopy, they might be biased towards having higher CTC counts.
Conclusions
This data is neat, and I’m all for taking different approaches to solving an important problem, but I am not yet convinced. In particular, there are a number of thorny statistical issues buried in those top-line numbers that are eerily reminiscent of past biomarker failures, and I’d want to know more about what’s going on in the gory details.