Mid-2019 Early Detection Roundup, Part I: Tumor Fraction
Grail reminds us that tumor fraction matters
The first half of the year is always exciting in the cancer world between results presented at AACR in April and ASCO in June, making it a good time to review the state of early detection science in mid-2019. This is long, so I’ll break it up into a series of blog posts, examining basic science, assay technology, and clinical data. We’ll start out by looking at some of the work presented by commercial entities this year; in particular, Grail and Guardant Health as the entities that have published the most so far this year. (If I’m wrong and I’ve missed a critical poster or paper, please send me a link on Twitter!).
My overall take: the “tumor fraction” thesis posited on theoretical grounds by myself and Olivier Elemento in our 2017 preprint is continuing to rack up experimental support: blood-based early detection looking for ctDNA (or really, any tumor-derived signal) is indeed fundamentally limited by the amount of circulating tumor DNA being very low in early stage. Consequently, we’re seeing limited progress on sensitivity, some progress on specificity, and (I suspect) a redirection of clinical goals from how screening has traditionally been targeted.
I do some new re-analysis of presented data in this post, and you can find the code and data to reproduce these data on GitHub.
Tumor Fraction Still Matters
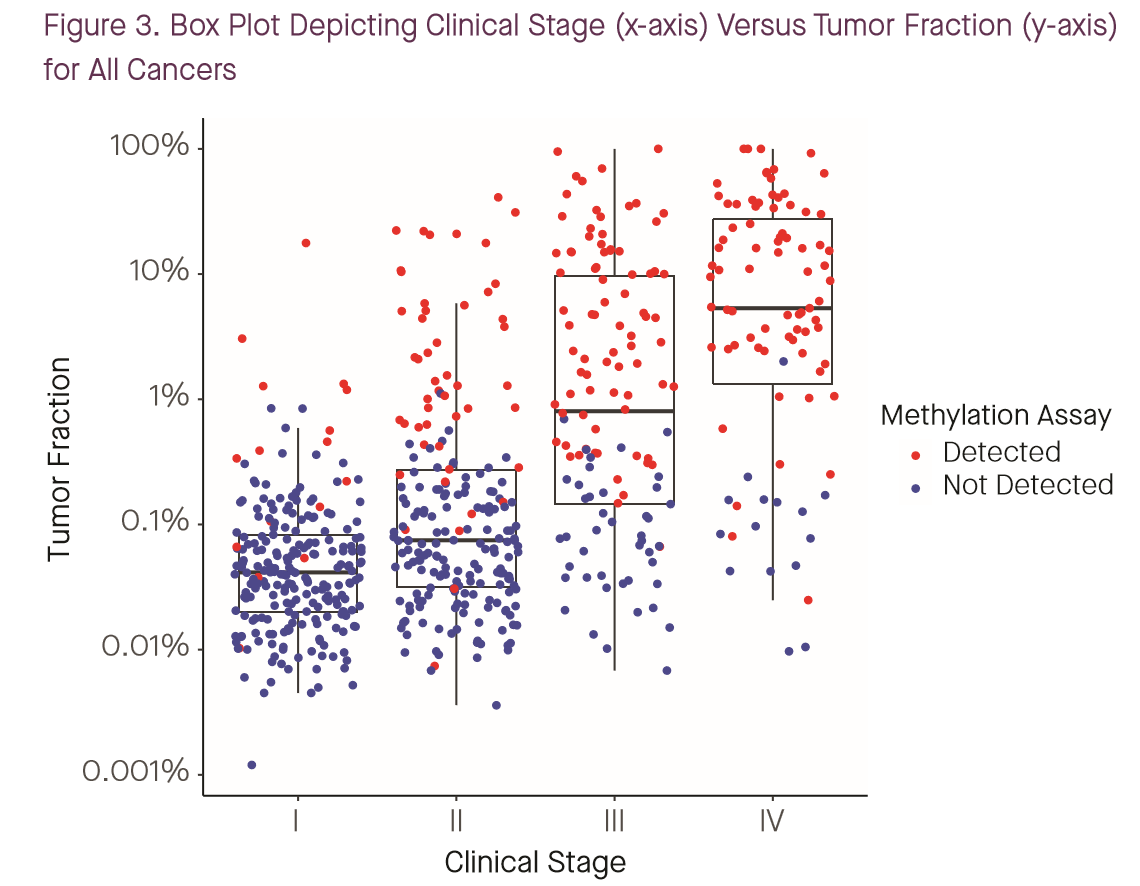
To their credit, both Grail and Guardant have stated to engage with the tumor fraction question head-on this year. A poster by Grail’s Oliver Venn and coauthors at Biology of Genomes stated outright that tumor fraction is the major determinant of performance for their assays, “explaining >99% of the variance in WGBS and WGS classification scores” (1). While Grail continues to define “early” or “earlier” stage cancers as stages I-III — a definition with which I disagree for reasons that will become clear — this year, they’ve gone a bit further and published not just stage-specific sensitivity numbers, but also stage-specific tumor fraction data along with sensitivity (1,2):
I have previously argued (see this poster from AACR 2018) that tumor fraction, not stage, is the most important determinant of sensitivity for such a test, and these tumor-fraction and sensitivity data can be combined with population information on staging to project likely real-world sensitivity. So I did that.
The image below shows the cumulative distribution of tumor fractions in the cancer-patient cohort from CCGA1 reported in Grail’s poster presented by Oxnard et al. at ASCO 2019 (2). (Data was extracted from the poster PDF and plots generated using code available at the GitHub link above.)
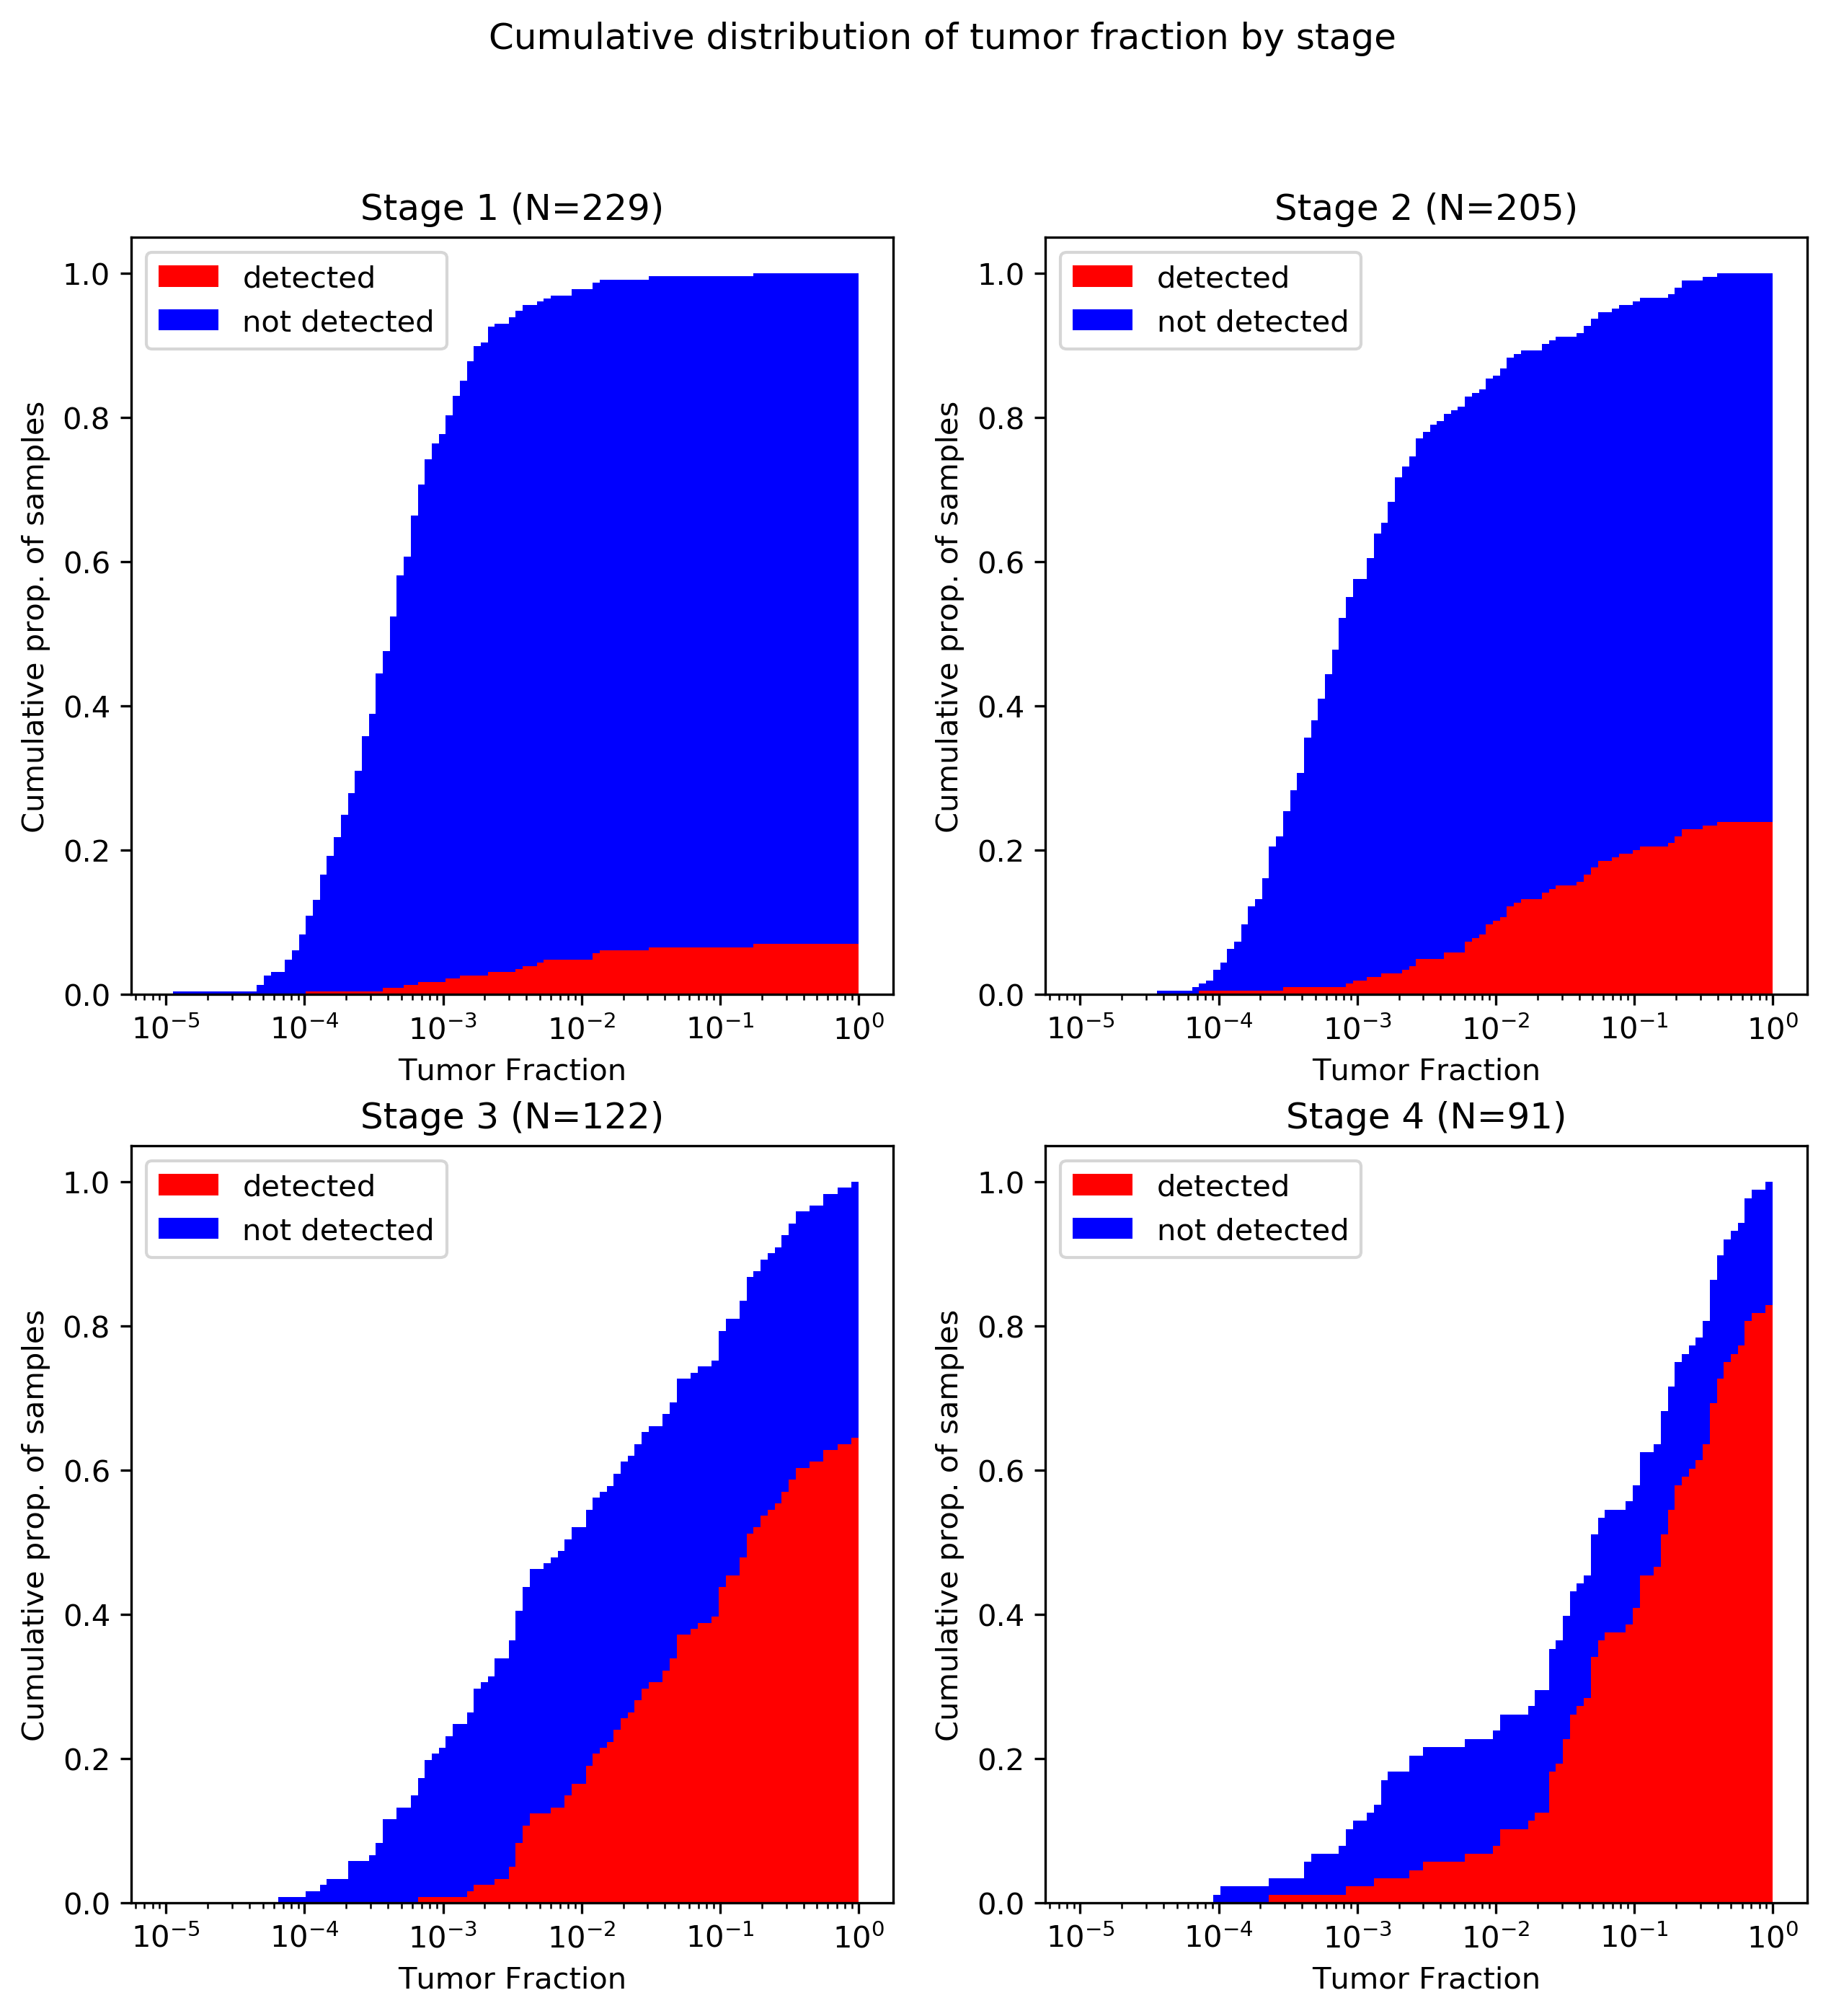
A brief primer on reading this plot: all four panels converge to 1.0 at x=1, as every patient had a tumor fraction of 100% or less (by definition). The red portion of the plot converges below 10% for stage I and above 80% for stage IV, indicating that overall sensitivity to stage I cancers was below 10% and above 80% for metastatic tumors. Note also that although the poster discusses 1,320 patients in total, I was only able to extract 647 data points from the plot. It is not clear if this is because of plotting limitations (e.g., samples with identical coordinates that were only drawn once) or because of missing data (e.g., samples with measured tumor fraction below the lower limit of detection omitted). Certainly, no samples were plotted with zero TF, so there is some loss to the latter mechanism. All tumor types are reflected in this plot; although cancer-specific data is available in the Biology of Genomes poster (1) I haven’t done the same data extraction for that poster yet.
There are three key takeaways from this plot:
- As expected, there’s a serious shift in tumor fraction distribution by stage, with earlier stage cancers way lower in tumor fraction. This is a one big part of why I object to Grail’s lumping together of all non-metastatic tumors: it’s WAY easier to detect stage III (with median tumor fraction <1%) than stage II (<0.1%) or stage I (<0.05%), so I think it’s misleading to put them all together.
- Grail’s ctDNA-based detection really seems to start working around 1% tumor fraction; below that, it’s a bit of a crapshoot.
- As a consequence of the first two, the vast majority of stage I and II cancers go undetected.
Bringing tumor fraction back into the clinical context
Let’s go further in the analysis. We know what the stage distribution is of a number of screen-detected cancers, in the normal screening population, thanks to large population studies that have been performed.
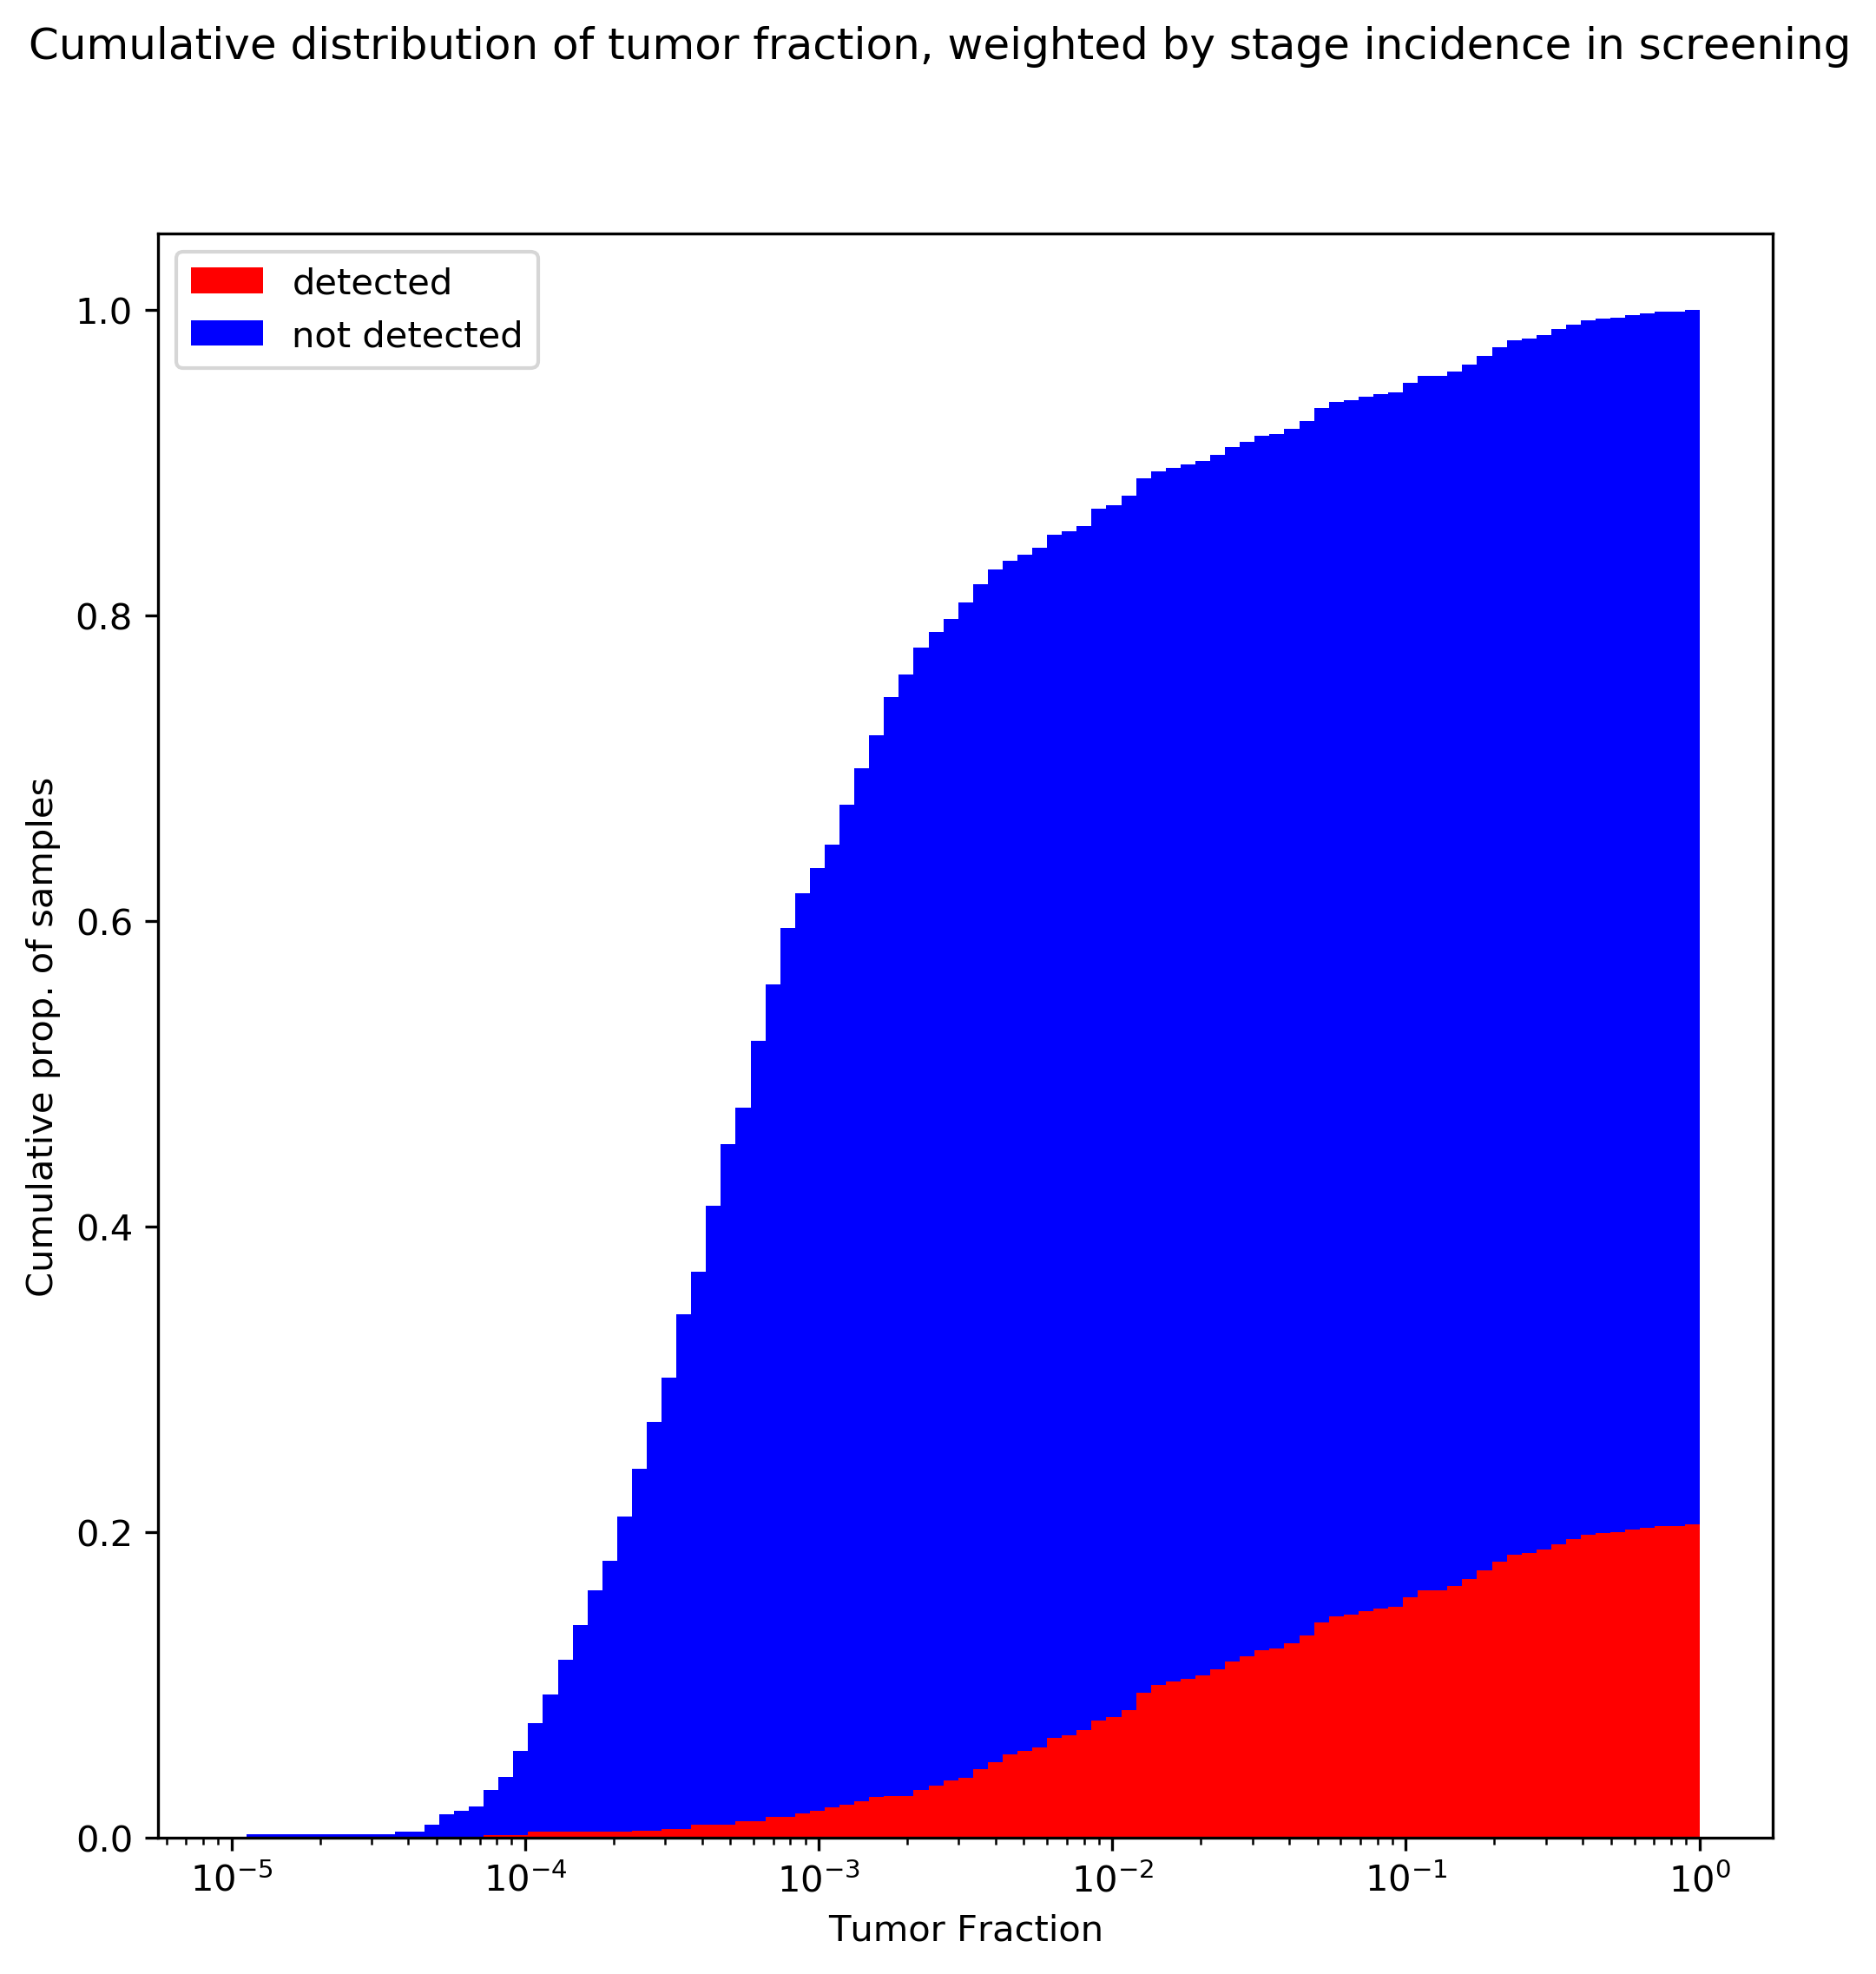
The above plot uses the stage distribution observed in Imperiale 2014, a ~10K patient study on colorectal cancer screening: 29/65 stage I, 21/65 stage II, 10/65 stage III, and 4/65 stage IV.
There are certainly some limitations to this analysis. In particular, I’ve taken tumor fraction data that is lumped from all tumors and applied screening stage-incidence rates from colorectal cancer, which implicitly assumes that that stage distribution is constant over all tumors (which probably isn’t true). This could be rectified by using the cancer-specific TF data from the Venn et al poster, and reweighting by stage rates observed in screening for individual tumors. In fact, there may be even more structure than that: the TF data in the Venn poster suggest similar stage I tumor fraction between breast and colorectal tumors; however, the stage-specific sensitivity reported by Grail in (3) is much lower for HR- breast tumors than for colorectal tumors, suggesting that tumor fraction differs by cancer subtype as well. This analysis also assumes that the tumor fraction distribution in CCGA’s mostly-clinically-presenting cohort would be similar to that observed in a true screening population (I suspect a screening population would actually be shifted even further to the left).
Conclusions
The above plot should be very concerning for ctDNA-based screening. The key takeaways:
- If these tumor fraction data are representative, in the general screening population we would expect at most around 20% clinical sensitivity for cancer! (This is the highest mark on the red curve: once you’ve integrated over all tumor fractions.) This trend is driven by the bias towards early stage cancers in the population, and the very low tumor fraction in these tumors.
- The above number is almost certainly an overestimate of sensitivity, not an underestimate. Remember that the tumor fraction data from the poster did not state how many samples had zero measurable tumor fraction; including these will shift all the curves over to the left, and since detection is driven by tumor fraction, will reduce overall sensitivity.
In the next posts in the series, I’ll take a look at how this fundamental technical limit has directed the technical and product strategies for both companies. Stay tuned.