Decoding the Peloton (PeloMon, Part I)
From Voltages to "Cadence, Output, and Resistance"
TL;DR - I’ve decoded (most of) the protocol that the Peloton bike uses to communicate with its head unit tablet and built a device, the PeloMon, that takes that data during a ride, without interfering with the Peloton software, to broadcast it over Bluetooth LE to whatever devices you’d like — a watch, Zwift, Wahoo, whatever. Stick around for logic analyzer traces, hardware diagrams, cursing at Bluetooth, and some nice interfaces.
First in a series. See the project GitHub, to be updated through the series.
- Part I: Decoding the Peloton
- Part Ib: How does the Peloton compute speed?
- Part II: Emulating the Peloton
- Part III: PeloMon Hardware
- Part IV: PeloMon Software
Table of Contents
- Intro
- Physical Layer (Hardware Used, Mapping Signals, Wire Protocol)
- Data Encoding (Packet Structure, Cadence and Power, Boot Sequence, Resistance)
- Conclusion (Pinouts, Protocol Description, Open Questions)
Intro to the PeloMon project
We have a Peloton at home. Originally, I was skeptical, but then I found trainers I like and it’s fun to ride with friends. And really takes the edge off all-day Zoom meetings to ride during a meeting with the camera turned off.
But, being the guy that I am, I’ve been curious about how the head unit — which runs a lightly skinned Android — was collecting stats from the actual bike. I was also a bit annoyed that though the Peloton software will happily read data from an HR sensor, and will upload your ride data to Strava, there was no way for it to broadcast data about a ride to a local fitness appliance — which meant that although I could track the fact that I was doing an “indoor bike” ride on my Garmin watch, the watch would see a 0 mile ride because it got no bike data.
Then a couple months ago, I came across this blog post in which someone on the Internet was able to hook up their (bricked) Flywheel bike to Zwift using a Raspberry Pi to decode the bike sensor data and broadcast it over Bluetooth — and I was inspired to finally give this project a shot. What should we call a device broadcasting stats from the Peloton, monitoring it if you will? How about “PeloMon”?
Let’s get down to it.
The Physical Layer: How does the bike talk to the tablet?
Hardware used
Any physical layer work is going to require actual hardware! I’ll provide links to all of the hardware involved in the project in case you’d like to follow along. I bought from a mix of Amazon and Adafruit; note that the Amazon links are affiliate links so if you end up buying there I’ll get a small referral bonus.
| Part name | Links | Price at time of writing |
|---|---|---|
| TRRS breakout board | Amazon | $6.98 (qty 3) |
| USB logic analyzer 24MHz 8ch | Amazon | $12.49 |
| 6” stereo headphone splitter cable | Amazon | $4.91 |
| 3ft aux cable | Amazon | $3.99 |
| 2.1mm DC barrel jack splitter | Adafruit | $2.95 |
Mapping the available signals
There are only two cables that plug into the tablet: a barrel jack carrying DC power @ 12V (coming from the power brick), and a TRRS connector — think “stereo aux cable”. So the data is clearly coming in on the latter. Since I only wanted to observe the traffic between the HU and the bike, not interrupt it, I used a headphone splitter cable to split the cable from the bike with an extra jack, and connected an aux cable from that extra jack to the breakout. Such a connection might disrupt some high-speed communications protocols, but my guess was that a) there wasn’t going to be that much traffic to require anything fancy, b) nothing fast would be running over 3.5mm TRRS, and c) this interface would be engineered with pretty wide tolerances for stability in a home environment. (Spoiler alert: all of these were true.)
The first step was to identify the pinout from the jack as best as possible. Probing the leads with a DMM with the bike active showed that Ring2 was at ground (0V with respect to the power supply’s ground) with -5.5-6V between tip or ring1 and ground. Sleeve also appears to be at ground, but it and Ring2 may not quite be the same (more on this later). The negative voltages with respect to ground are a pretty strong sign that we’re going to see RS-232 signaling.
Decoding the wire protocol with a logic analyzer
(If you’d like to load a PulseView trace to see the data for yourself, one session
file from a test ride is located in peloton_decoding/resistance-stepped-10s.sr
in the PeloMon GitHub repository.)
Normally I’d wire up the breakout and hack something together on the Arduino I have sitting around, but it turns out that logic analyzers have gotten really really cheap so I splurged on a $12.50 one and thought I’d give it a whirl — turned out to be a great idea that made it WAY easier to decode the signals. With complete abandon regarding ground isolation and the voltage tolerances of the LA (is it supposed to be able to handle negative voltage?), I hooked it up to see what I’d get. These cheapo LAs emulate a Saleae Logic analyzer and work fine in the open-source PulseView software.
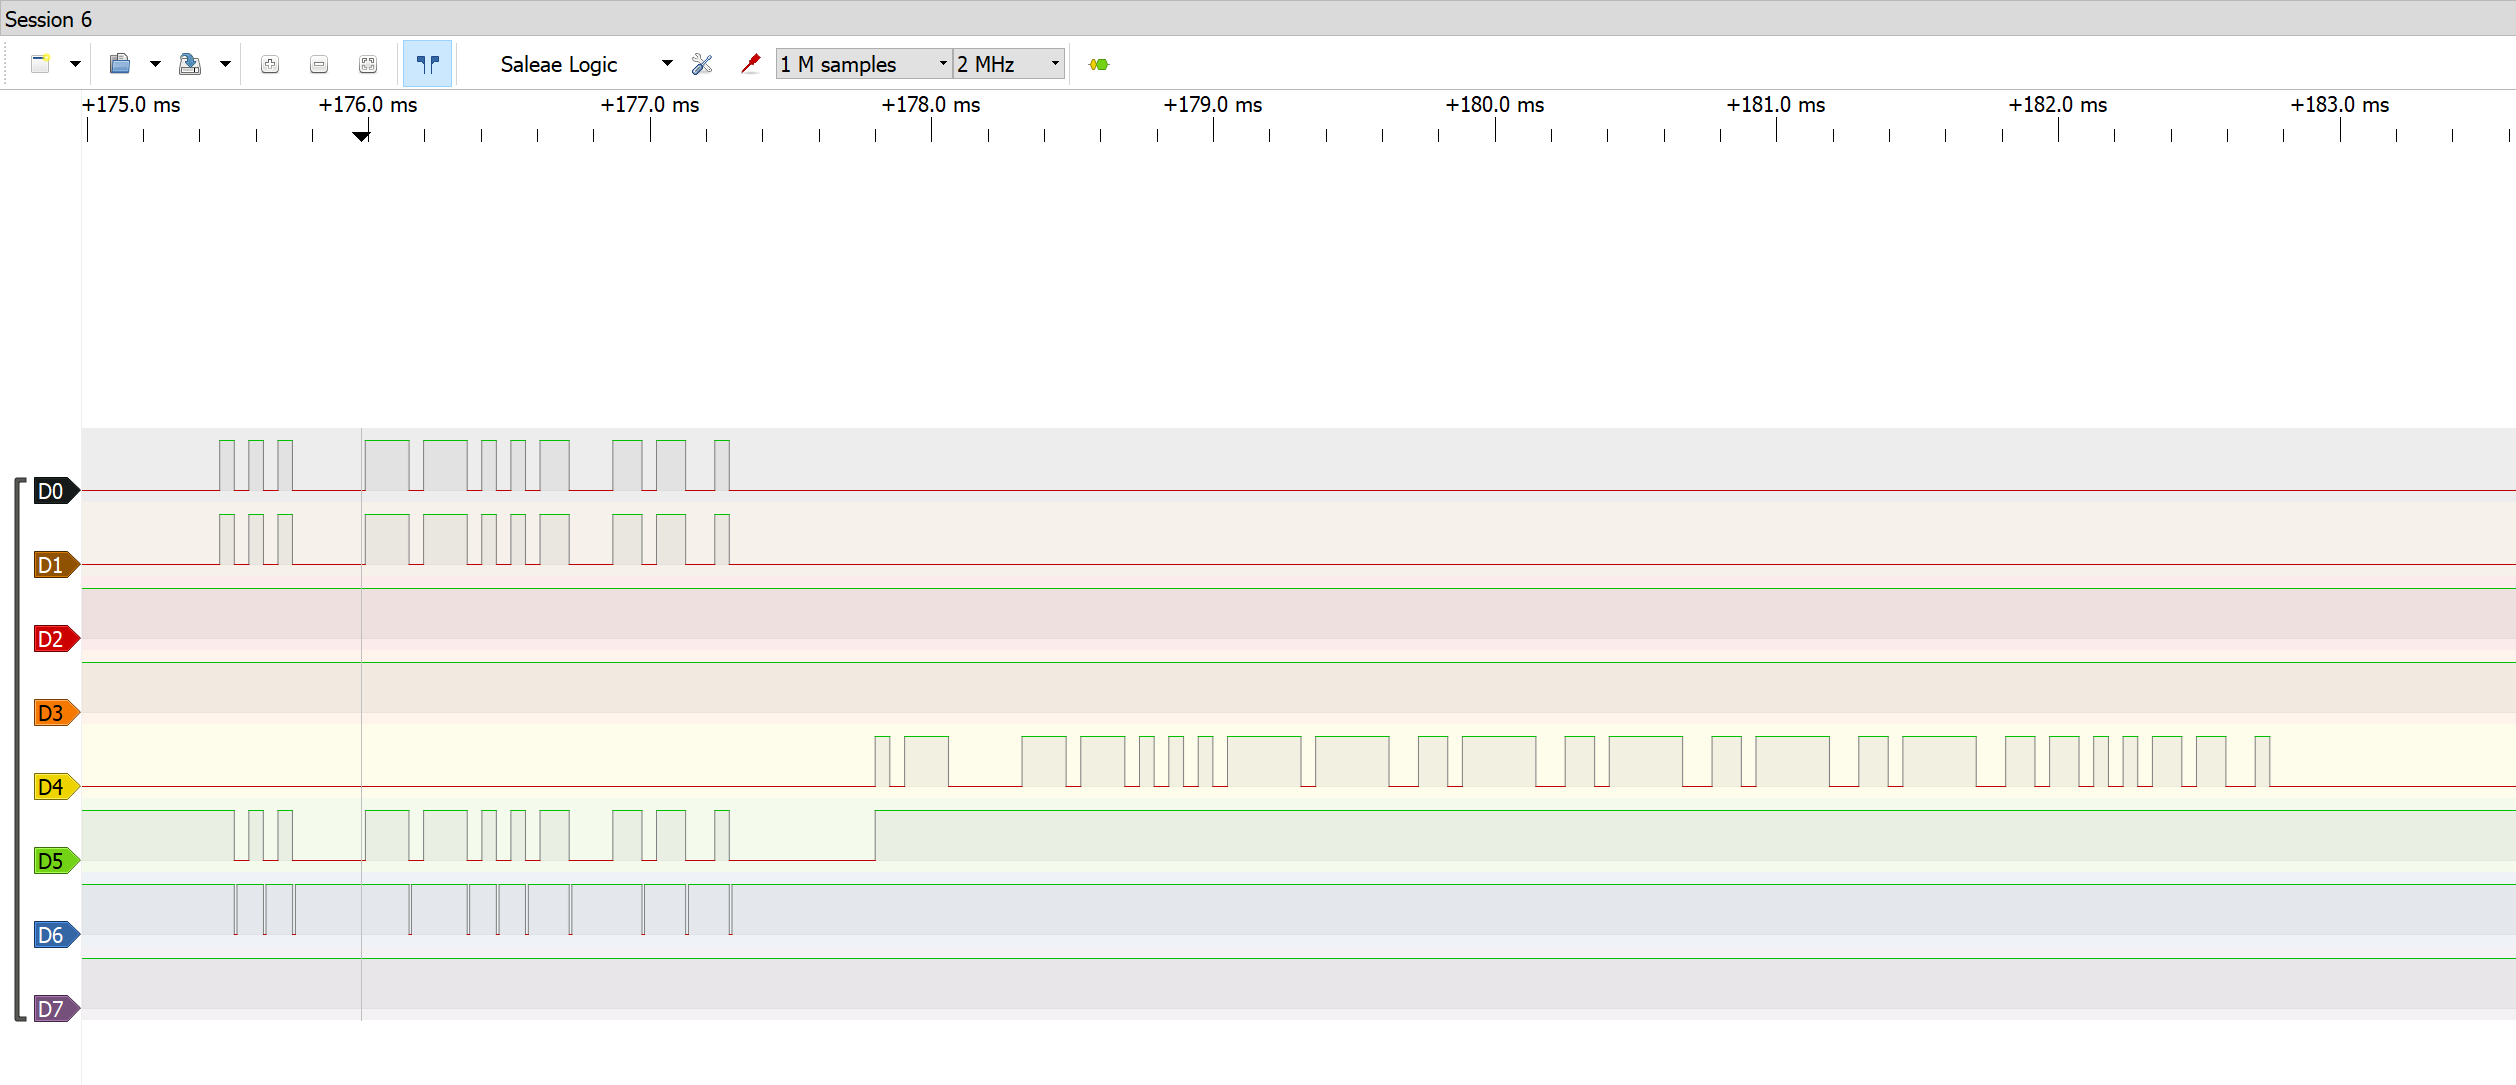
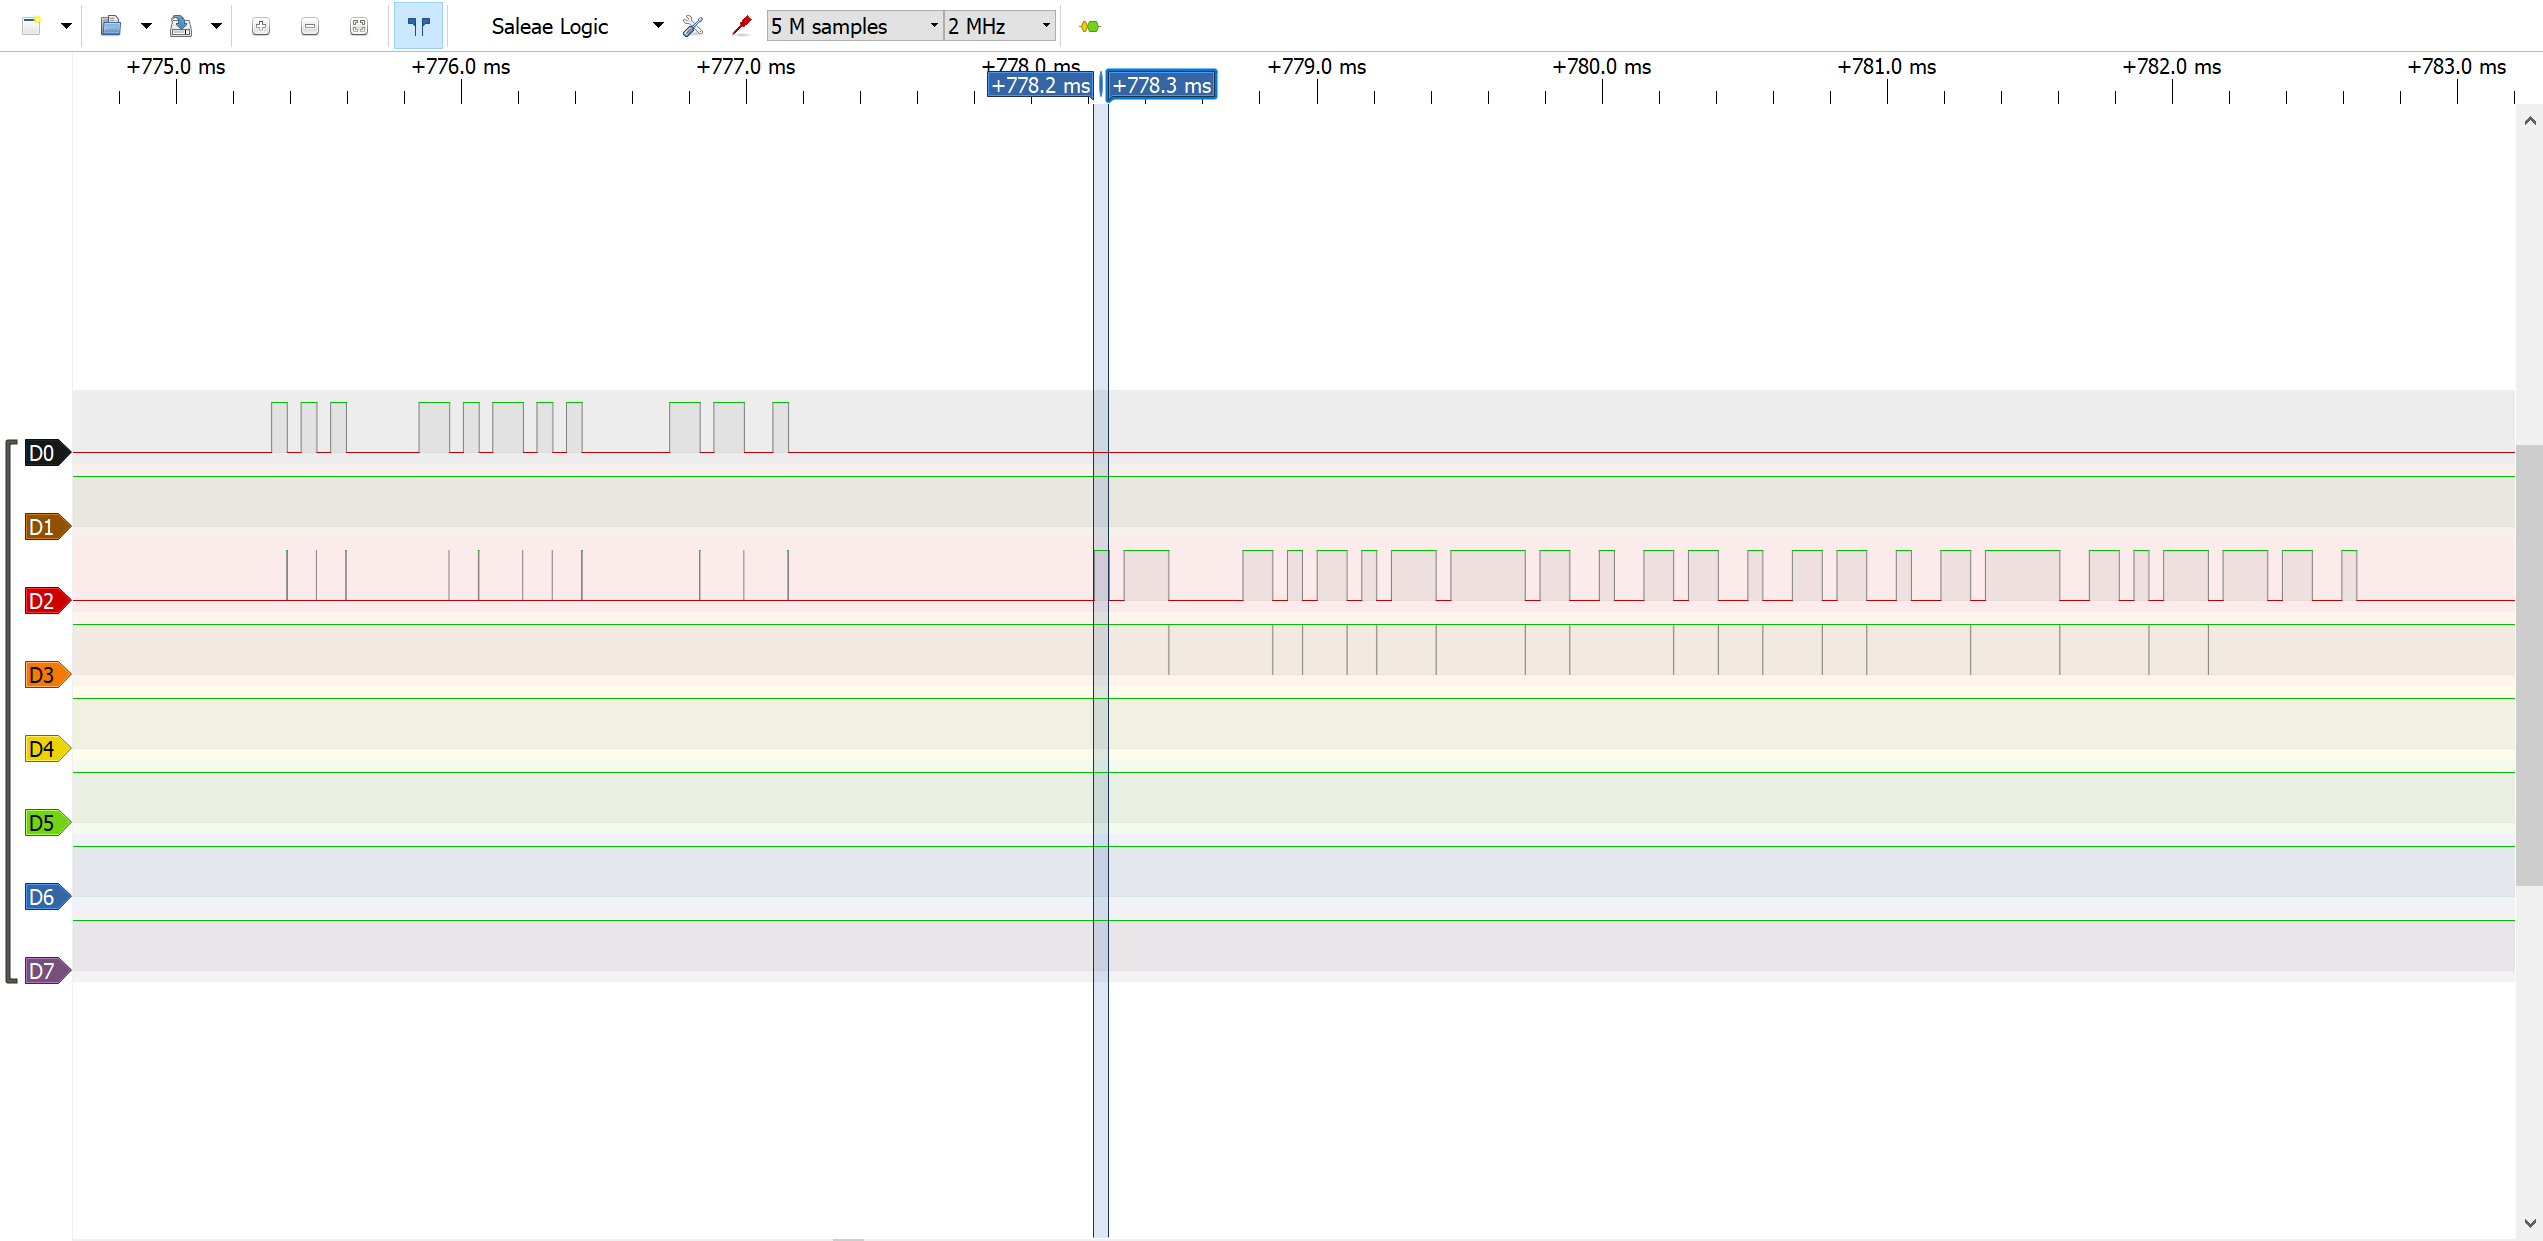
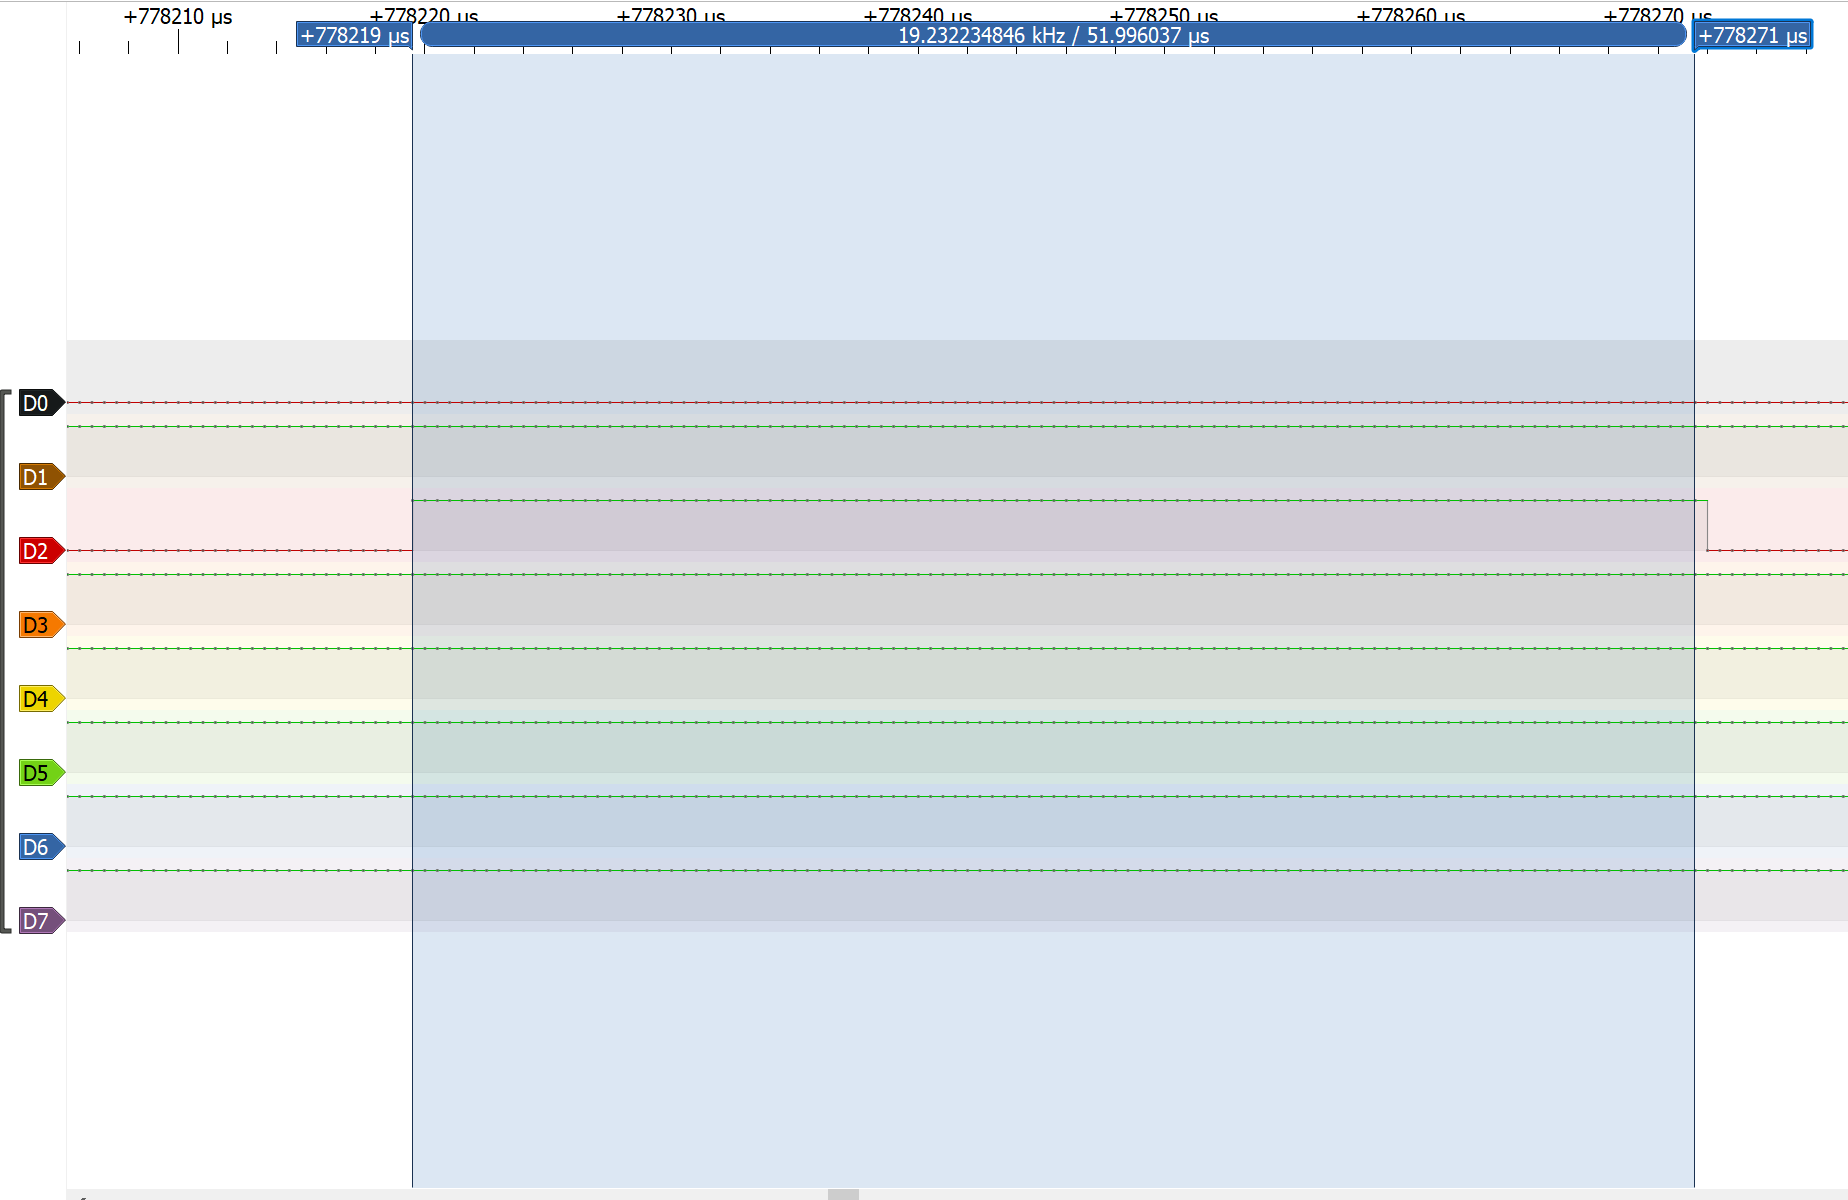
There’s pretty clearly serial signaling going on over these wires! One party seems to be sending requests on Tip every 100ms, and the other party responds about a millisecond later on Ring1. While it wasn’t obvious from the DMM whether signaling GND should be on Ring2 or Sleeve, from the LA traces, it looks like there is less glitching on the response line if Ring2 is used as GND - so we’ll do that. The narrow pulses are probably single bits, so sampling at a high rate (a few hundred kHz) lets us measure the bit rate as 19200bps:
PulseView also lets you add protocol decoders to particular wires. I put a UART decoder on with D0 as “RX” and D4 as “TX”, and saw data, but with a ton of low-level serial protocol errors. UARTs invert the signal going out on the wire with the expectation that there will be another UART at the other end to re-invert. Since we don’t have that second UART, we have to turn the “Invert RX” and “Invert TX” options on in PulseView, and then we see clean data! I also experimented with other serial options (data, parity, and stop bits), but the first guess of 8N1 turned out correct.
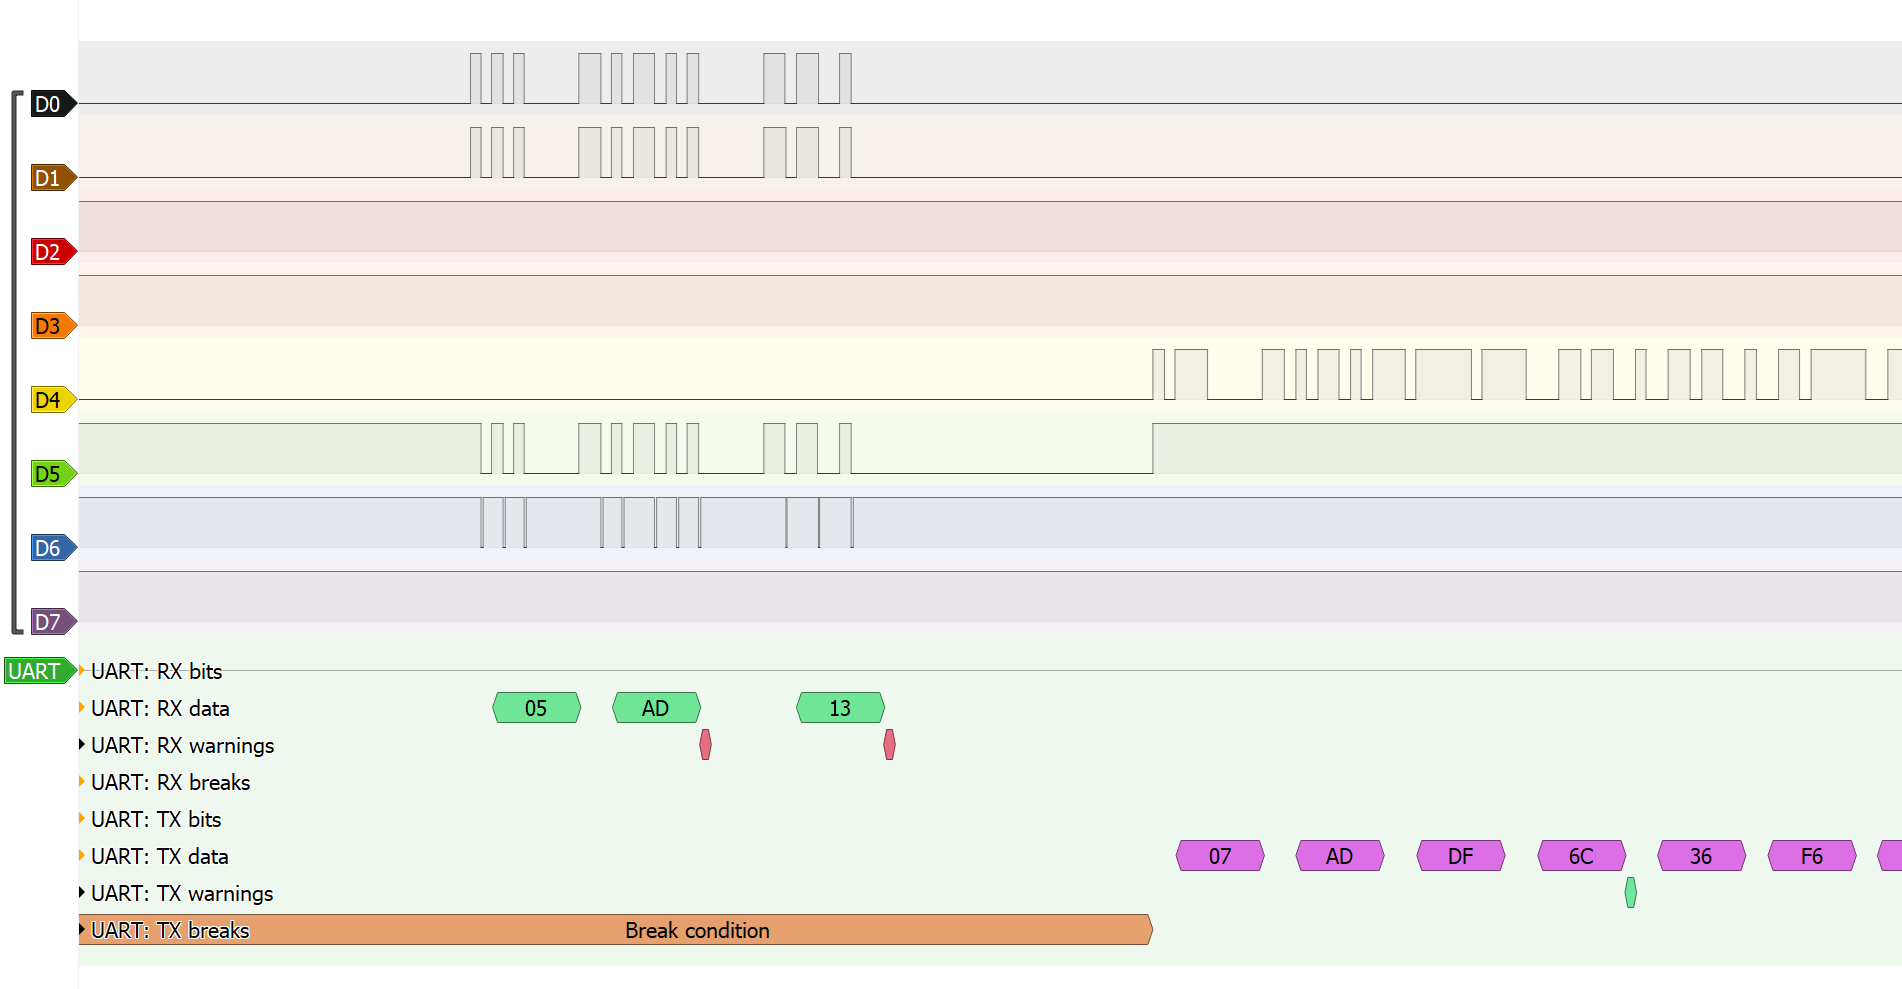
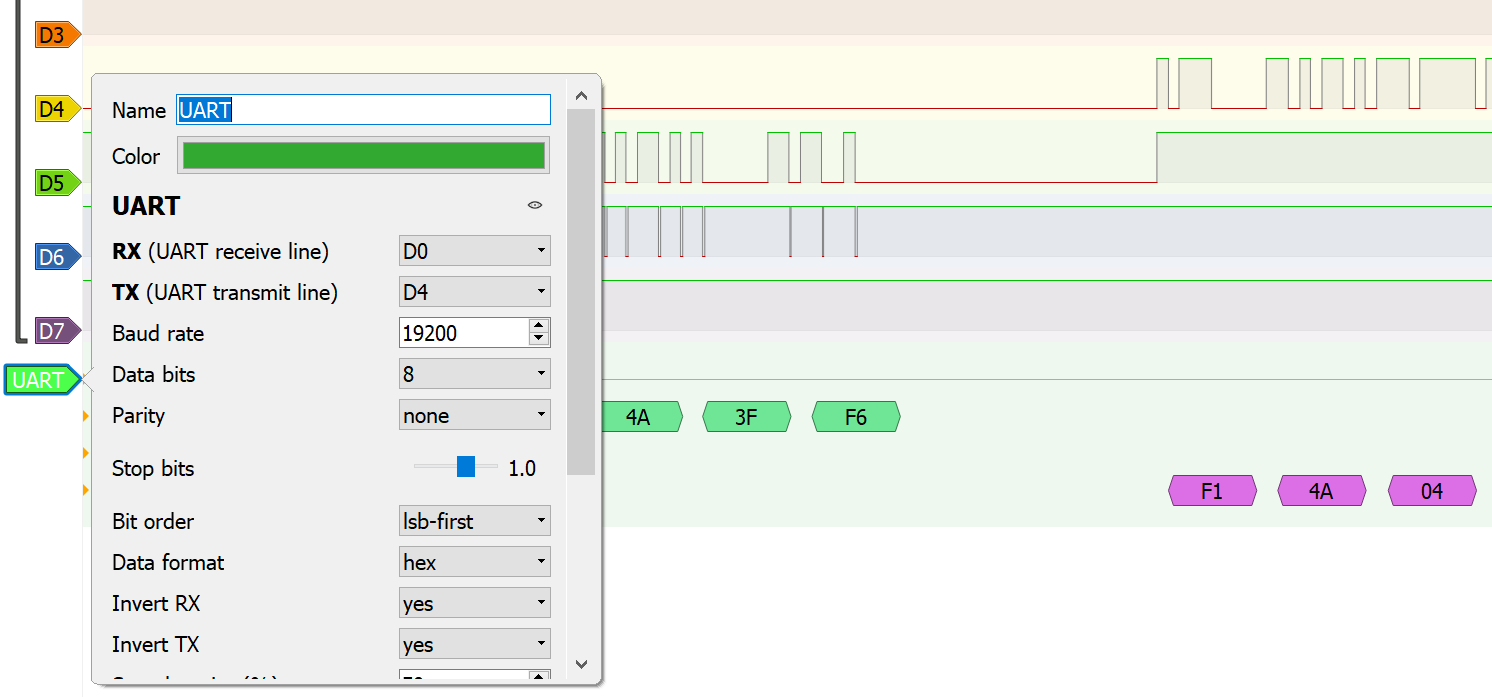
Following the data streams, we see that the data stream on the Tip wire during a ride always consists of one of three different four-byte packets, repeated round-robin every 100ms, with the responses on Ring1 to these requests being longer, different in length depending on the request type, and variable in content. It seems likely then that the Tip shows us signaling from the head unit to the bike, and Ring1 is the bike responding to the head unit with information about variables like current speed, resistance, or power output.
Thus, we’ve worked out the physical layer protocol for the Peloton communications: RS-232 at 5.5V and 19200bps 8N1 encoding, with HU-to-bike communications on Tip, bike-to-HU on Ring1, GND on Ring2, and something ground-like on Sleeve.
Data Encoding: What are the head unit and bike saying to each other?
To investigate the encoding between the head unit and the bike, I used the
logic analyzer to capture a trace of the communications during a ride. (Shoutout
to Ben Alldis and his Ministry of Sound ride series!)
The data dump and scripts are available in the GitHub repository for this project
at https://github.com/ihaque/pelomon/, in the peloton_decoding subdirectory.)
Basic packet structure
(To follow along, run peloton_decoding/decoder_plots.py from the
PeloMon Github repository.)
During a ride, about every 100ms (100.66-100.8ms) the HU sends a request to the bike, and the bike responds about 300us (i.e., 0.3ms) from the end of the HU’s request. The HU sends three different request packets round robin. Each request type has a different response length from the bike:
| HU Request | Bike Response Length | Example Bike Response |
|---|---|---|
| F5 41 36 F6 | 8 bytes | F1 41 03 30 30 30 C5 F6 |
| F5 44 39 F6 | 10 bytes | F1 44 05 30 30 30 30 30 2A F6 |
| F5 4A 3F F6 | 9 bytes | F1 4A 04 38 36 36 30 13 F6 |
A few things are evident from simple inspection of the bytes:
- The first byte is a header - seems to be F5 from the HU and F1 from the bike.
- All packets end in F6.
- The second byte that the HU sends seems to be a request type, and is mirrored in the second byte in the bike’s response.
- The third byte of the bike response is the length of the full packet minus 5 — probably indicates the length of the data payload following it.
- Serial packets often carry a checksum, and here the second-to-last byte from either the HU or the bike seems to be that: it’s the sum (modulo 256) of all the bytes preceding it.
Thus, the packet format seems to be:
- HU:
F5 [request type] [checksum] F6 - Bike:
F1 [request type] [payload length] [response bytes 1-n] [checksum] F6
We can now throw together a quick plot of each response byte to look for patterns.
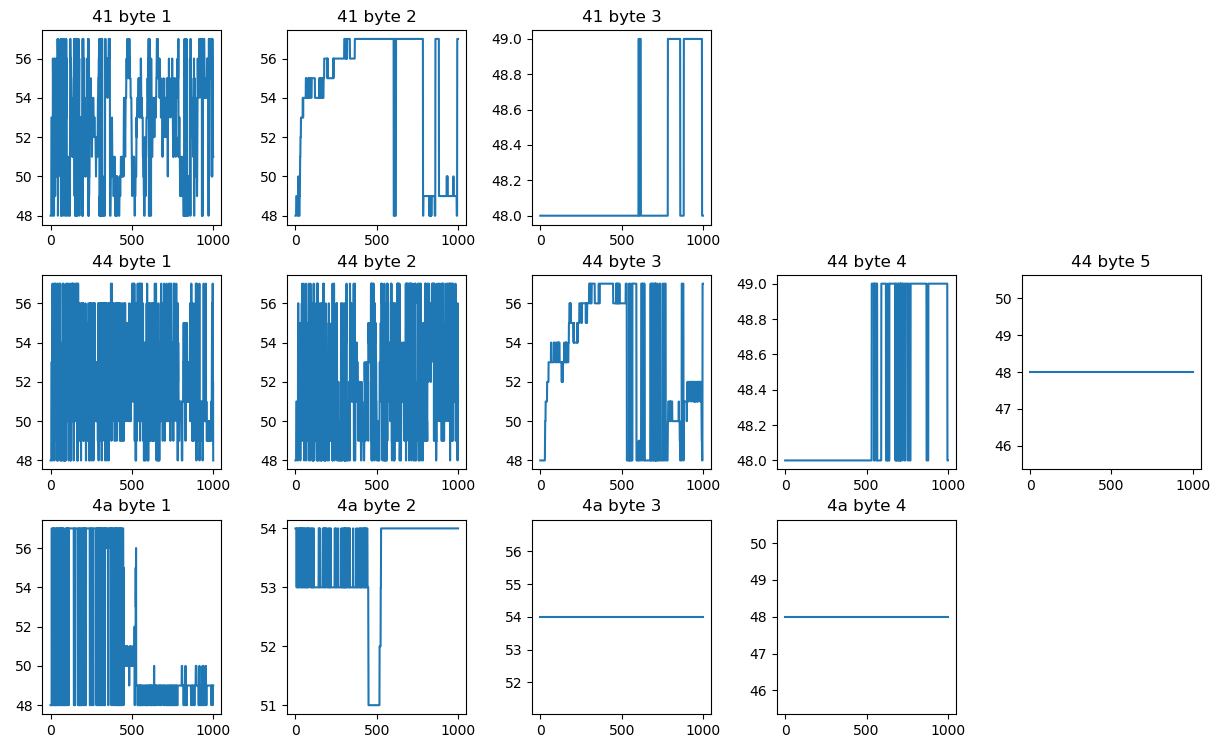
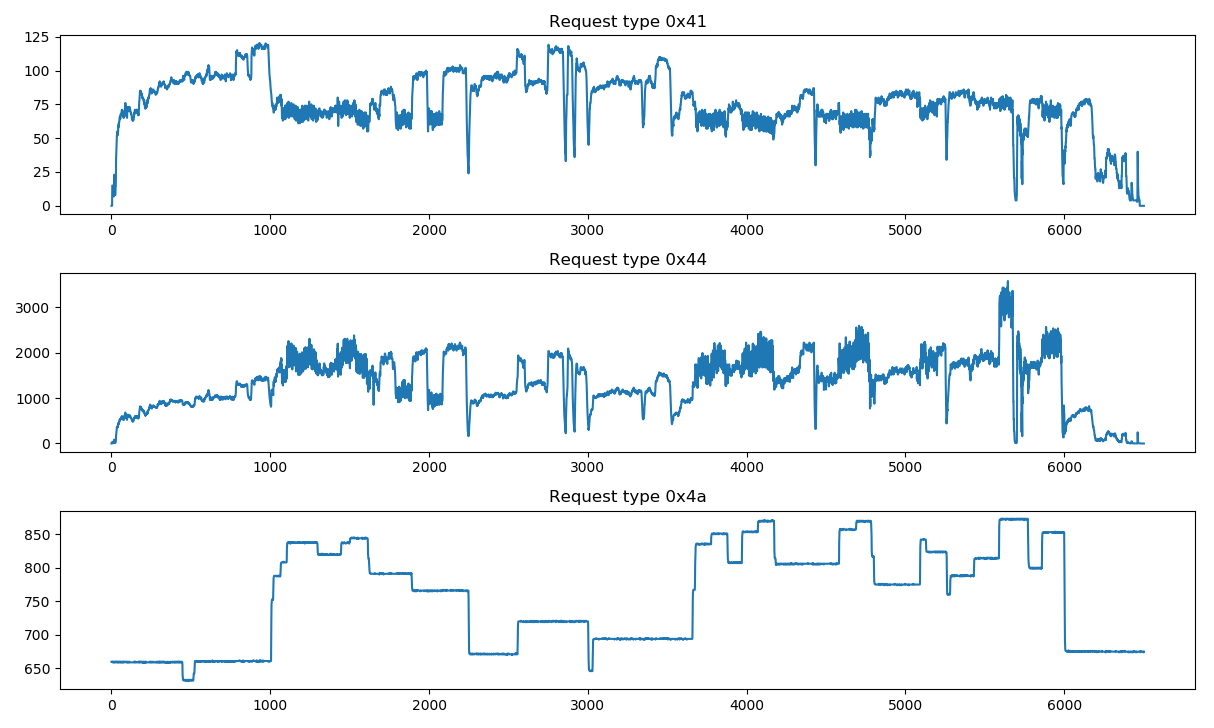
It appears that every byte ranges from 0x30 to 0x39 — which is exactly the ASCII range for decimal digits 0 through 9. Furthermore, the earlier bytes in each packet appear to vary more quickly than the later ones through a ride, suggesting that the least-significant digit comes first. The Peloton bike is encoding its responses as little-endian ASCII digits. It’s easy enough to dump a plot of these values per response type now that we know the encoding:
Decoding cadence (RPM), power, and (almost) resistance
(To follow along, run peloton_decoding/decode_resistance.py from the
PeloMon Github repository.)
Glancing at these graphs it’s pretty clear that we have ride data of the Peloton trifecta — cadence, power, and resistance — with a couple weird things thrown in for flavor. Comparing to the Peloton ride stats, request type 0x41 seems to directly return cadence in rpm and request type 0x44 returns 10 times power in watts (i.e., current power output in deciwatts). However, while the shape of request type 0x4a looks spot-on for the resistance graph, the numbers are crazy, ranging from around 650 to almost 900.
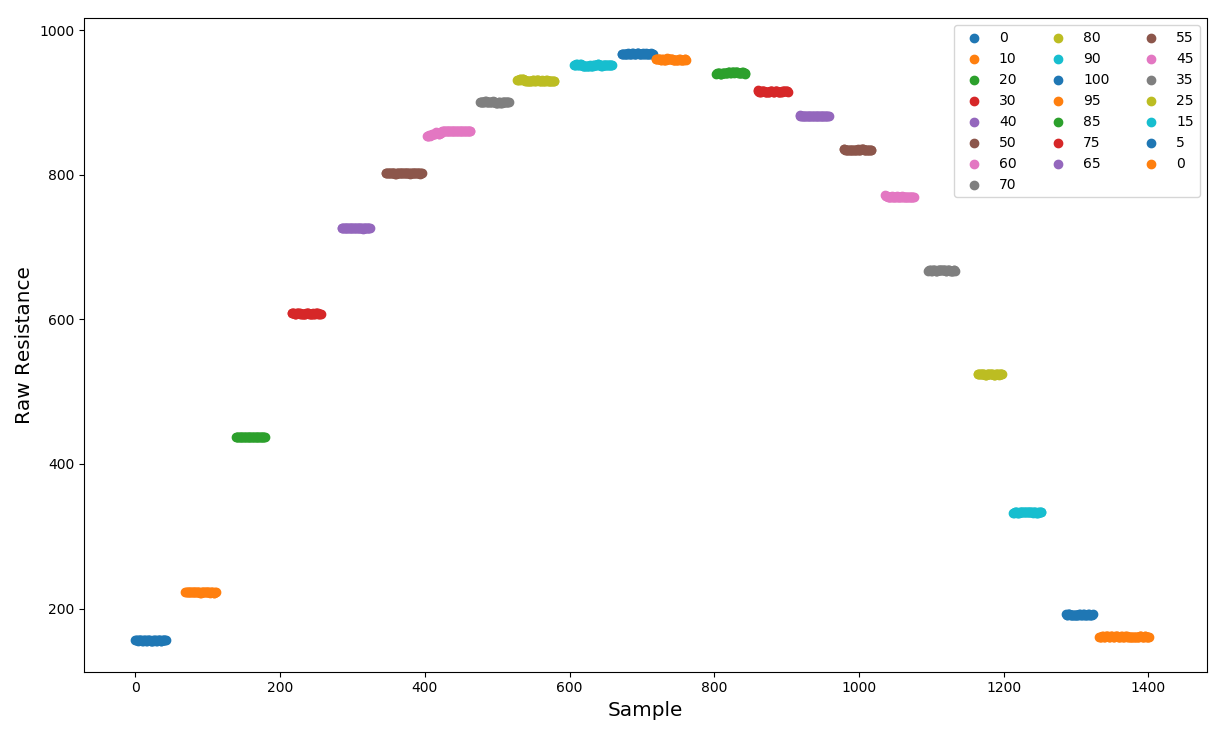
The obvious thing to do here was to collect more data. I used the logic analyzer to log the signals from a test ride, where I stepped resistance by 10 points in sequence (starting at 0, to 10, 20, …, 90, 100, then back down to 95, 85, …, 5, 0) and held each resistance level stable for at least 10 seconds before moving to the next. Since the HU messages the bike every 100ms and only every third message asks for resistance, this should give us about 30 (10s / 300ms) samples at every resistance value from 0-100 in steps of 5, with plenty of margin between levels. Indeed, that’s what we see (after grouping stable levels and filtering out the samples when the knob was moving):
It’s super easy, then, to plot the raw resistance against the known resistance…
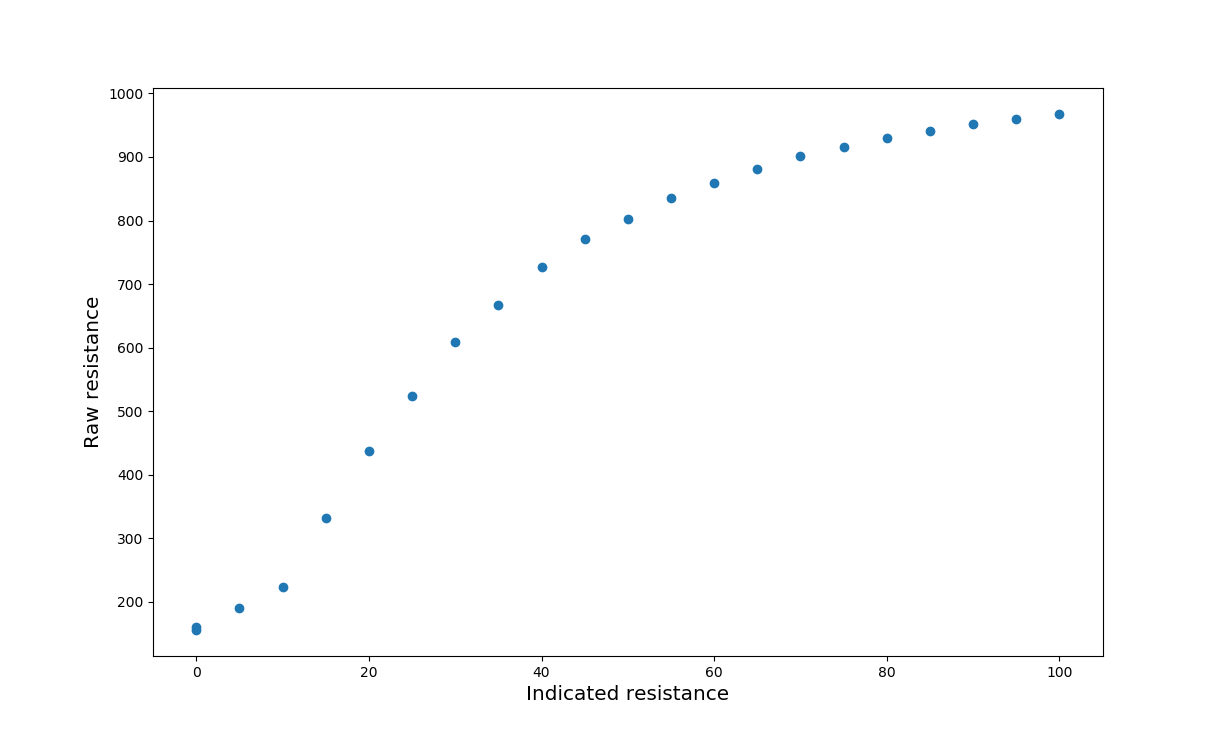
This curve is very much nonlinear. On one hand, this is to be expected: our perception of force is nonlinear, with an exponent between 1.4 and 1.7, a relationship known as Stevens’s law. But the curve here looks more complicated than that; in particular, notice that while the curve from 15-100 is pretty smooth, there is a bit of a kink in the curve below that, with a nearly linear relationship between indicated and raw resistance below 15%. There’s also very little resolution at the top end of the curve (which I noticed during the experiment, too; it was surprisingly hard to nail the resistance to an exact percentage point at 95%).
What to do with this? One option would be to simply fit a regression curve to the given values. But an article on the Peloton support site says that bikes are individually calibrated for resistance from the factory. This suggests that perhaps there is a mapping stored on the bike itself somewhere that maps these raw sensor values to the (normalized) resistance percentage reported by the Peloton software… but we’re not seeing any values that might correspond to this.
A detour: what happens when you boot up the bike?
The calibration information must be stored in the bike, not the head unit. How do I know? Well, when we moved, our movers smashed up the screen of our bike, and Peloton sent us a replacement that I was able to hook up and get working with no fuss. While it’s possible that Peloton HQ knows the calibration of our bike and flashed it into a head unit for us, that seems like an unlikely waste of support time — it would be way more reasonable for it to be stored on the bike and queried by the HU. If it’s not coming during a ride, maybe it comes when the HU starts from a cold boot and is cached during the HU’s uptime?
With this idea, the logic analyzer went once more unto the breach, this time logging the traffic while the head unit boots up. Lo and behold - new packet types! The back-and-forth is shown in the table below, with some values redacted for reasons I’ll explain shortly:
| HU request | Bike response |
|---|---|
| FE 00 | F1 FE 03 35 31 30 |
| F5 FB | F1 FB 07 01 UU VV WW XX YY ZZ |
| F7 00 | F1 F7 34 36 31 30 |
| F7 01 | F1 F7 39 36 31 30 |
| F7 02 | F1 F7 36 38 31 30 |
| ... | ... |
| F7 1D | F1 F7 33 36 39 30 |
| F7 1E | F1 F7 37 36 39 30 |
There are three new “classes” of packets that we see only appearing on bootup and some changes to the patterns we’ve previously observed.
The very first packet coming from the HU starts with 0xFE (previously, we had only seen HU requests start with 0xF5), and the bike’s response has 0xFE in its request type field, whereas other packets would have had the second byte from the HU in this field. The response looks like ASCII numbers and would correspond to 015 if little-endian like other such responses, but truth be told, I don’t know what this one means — it might be a protocol version request (0.1.5?) or similar as part of a handshaking protocol at the start.
The second request/response look more normal - the HU’s request starts with 0xF5 with request type 0xFB, and the bike’s response type is 0xFB. However, the values returned for once are not ASCII digits. Digging around a little bit in the Peloton software info suggests that this pair is retrieving the bike ID. Given the response bytes “UU VV WW XX YY ZZ” rendered in hexadecimal, my bike ID was TuuVVPLWWXXYYZZ, where uu is the decimal rendering of UU. Asking a few friends for their bike IDs and lining that up with when they each bought Pelotons suggests that uuVV may be the year and month that the bike was manufactured (e.g., 1909 would be September 2019, and would show up as UU=0x13, VV=0x09; in which case both UU and VV may need to be rendered in decimal (anyone got a Peloton manufactured in October, November, or December to confirm?). Bytes WW,XX,YY,ZZ are directly rendered into the ID string; all of the friends I asked only had decimal digits there, so it’s possible that not all of the hexadecimal space is actually used. I have no idea what the leading 01 is — maybe it identifies “Bike version 1”?
The third class of request/responses actually comes in a block of 31 sequential requests that look like reading out a block of memory or a lookup table. The HU sends F7 00, F7 01, …, F7 1E (note: these requests start with F7 rather than F5), and the bike responds with what again appears to be little-endian ASCII numbers (but with the response type byte having F7, not the 00/01/…/1E byte). The values returned by the bike (when interpreted as little-endian ASCII) are monotonically increasing as the hypothetical “address” requested by the HU increases. This seems like a really strong candidate for the resistance calibration data.
Decoding resistance (for real, this time)
What if we did the simplest possible thing, and just linearly map these values to the range 0-100% (that is, the value at F7 00 corresponds to 0%, the value at F7 1E to 100%, and everything else linearly spaced in between)?
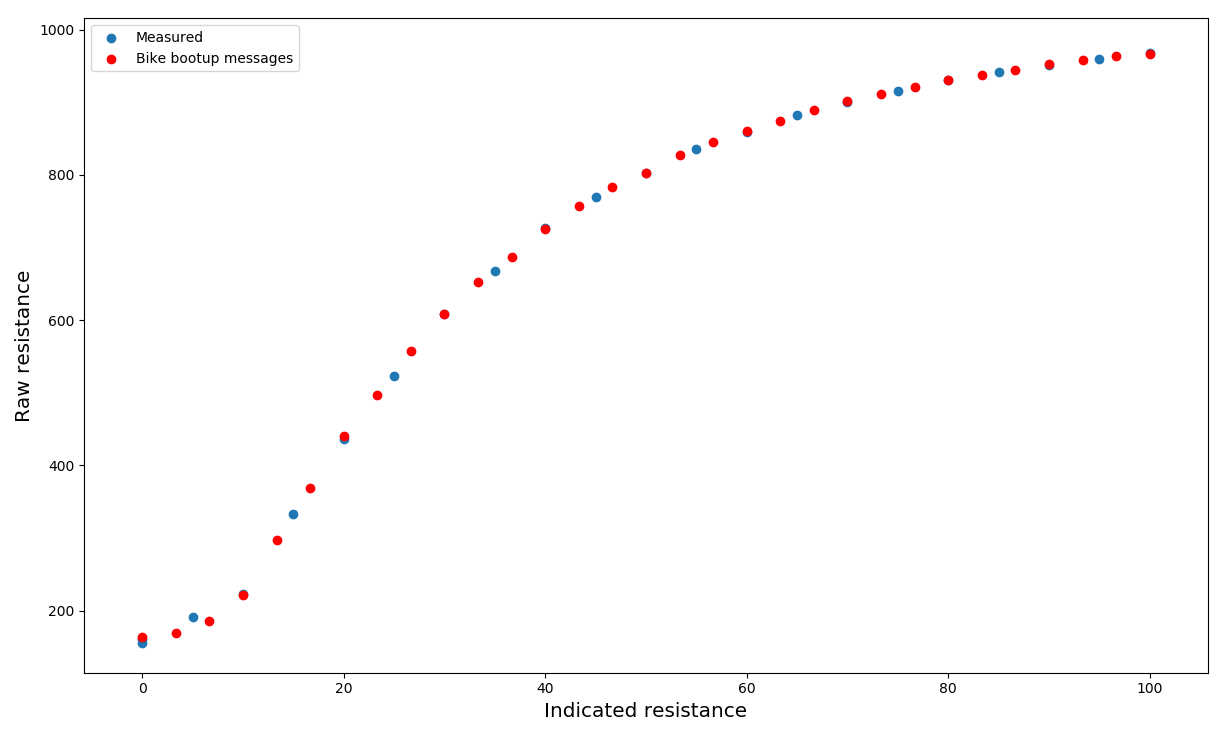
The values line up (almost) perfectly! Besides the fact that my experiment sampled every 5% and the lookup table transmitted at boot is apparently sampled every 3.5%, and one experimental data point at 10% resistance that appears slightly off, the curves track exactly against each other. So it seems that the Peloton bike transmits a resistance calibration lookup table at bootup; during rides, it only transmits raw resistance sensor values (probably the output from a rotary encoder on the resistance knob, or possibly a linear sensor on the magnetic brake), and the head unit uses the lookup table to interpolate the normalized resistance for display.
Conclusion
At this point, we have an almost complete catalog of the messages that the Peloton HU and Bike send to each other at bootup and during a ride to communicate your cadence (crank speed/rpm), output (power), and resistance (normalized from 0-100%) to the display, in addition to some extra data containing the bike ID. Here’s a quick summary table:
Pinouts of cables from bike to HU
| Connector | Signal |
|---|---|
| TRRS tip | HU to bike serial |
| TRRS ring1 | Bike to HU serial |
| TRRS ring2 | GND |
| TRRS sleeve | GND? |
| Barrel tip | +12VDC |
| Barrel sleeve | GND |
Serial communications on the wire are inverted at a voltage of -5.5-6V with respect to GND. Data protocol is RS-232 @ 19200bps 8N1.
Protocol Description
Message descriptions written from the perspective of the HU.
- All message bytes written as hex in the order they are sent on the wire.
CSstands for the checksum byte, computed as the sum mod 256 of all prior bytes in the message. For example, given a message01 A0 33 CS F6, the expected checksum would beD1, giving a final message of01 A0 23 D1 F6`.- All messages sent by the HU are of length 4. Bike responses are variable length and contain a “payload length” byte as the fourth byte. Payload is marked in brackets to make it easier to see.
| Name | HU bytes | Bike response length (# bytes) | Example bike response bytes | Description |
|---|---|---|---|---|
| Messages sent only at bootup | ||||
| UNKNOWN | FE 00 CS F6 | 8 | F1 FE 03 [35 31 30] CS F6 | First message sent at startup. Meaning unclear. |
| GET BIKE ID | F5 FB CS F6 | 12 | F1 FB 07 [01 13 09 12 34 56 78] CS F6 | Returns identifier of bike. |
| GET RESISTANCE CALIBRATION VALUE xx | F7 xx CS F6 | 9 | F1 F7 04 [34 36 31 30] CS F6 | Second byte of request identifies which resistance calibration value (31 even samples from 0-100% inclusive) to return. Data payload is little-endian ASCII corresponding to raw resistance value for requested normalized resistance. HU sends 31 of these packets, with xx ranging from 00 to 1E, at startup. Note that xx is not returned in the bike response. |
| Messages sent during a ride (round robin, 1 every 100ms) | ||||
| GET CURRENT CADENCE | F5 41 CS F6 | 8 | F1 41 03 [34 38 30] CS F6 | Current crank cadence in rpm as little-endian ASCII. |
| GET CURRENT OUTPUT | F5 44 CS F6 | 10 | F1 44 05 30 35 35 31 30 CS F6 | Current power output in deciwatts as little-endian ASCII. |
| GET CURRENT RAW RESISTANCE | F5 4A CS F6 | 9 | F1 4A 04 38 36 36 30 CS F6 | Current raw resistance value as little-endian ASCII. Must be decoded using resistance calibration table sent at startup to translate to normalized 0-100% resistance. |
Open Questions
The protocol information above is mostly enough for my goal: cadence, speed, and power over Bluetooth to pair with other fitness trackers. But there are a few open questions left on the low-level protocol:
- What does the first message (
FE 00) ask and what does the response mean? - What does the first payload byte of the response (
01) to the BIKE ID query mean? - Are there other messages to which the bike will respond? There seems to be ample
address space inside the
F5 41/44/4A/FBregion. What happens if you request values beyond 1E from the resistance table? What else is legal? - Related to the above: there must be a protocol to set values in the bike’s controller hardware (for example, at the factory for resistance calibration). Which messages write to the bike rather than just reading? And is there a different format for them, as the current HU message format doesn’t seem to have space for a payload (unless write commands pack the address and command into the first byte, and payload into the second, or vice versa).
- The HU only polls the bike for cadence, output, and resistance every 300ms apiece (round robin of three signals at 100ms intervals). The bike responds very fast - under 1ms from the end of the HU request. What is the underlying rate at which the bike reads and integrates its sensors and is it feasible to get better time resolution for things like power which can vary quite fast?
(There is also the question of how the Peloton software gets speed out of a system that only reports cadence, power, and resistance, but we’ll address that in a later post!)
If you can shed any light on these open questions, or any questions about the
details figured out so far, drop me a line on
Twitter and tag it #pelomon!