How does the Peloton compute speed? (PeloMon, Part Ib)
It's not obvious.
TL;DR - Speed on the Peloton Bike is a pure function of power and can be accurately regressed with a two-piece polynomial fit. Code is available at the project GitHub repo.
Second in a series. See the project GitHub, to be updated through the series.
- Part I: Decoding the Peloton
- Part Ib: How does the Peloton compute speed?
- Part II: Emulating the Peloton
- Part III: PeloMon Hardware
- Part IV: PeloMon Software
Where does the speed measurement come from?
In Part I I decoded the signaling protocol that the Peloton Bike and its head unit use to communicate with each other over the signal wire connecting the two, and saw that cadence, power, and a “raw” measure of resistance are actually computed on the Bike and transmitted directly to the tablet; the raw resistance from the Bike is decoded on the tablet to the displayed 0-100 resistance using a calibration table that the Bike transmits to the head unit at bootup. Conspicuously missing here from the list of values that you see during a ride is speed. How does the combined system (bike and tablet/head unit) measure or compute that value?
On a real bike, this would be straightforward to measure: it’s a direct function of cadence, gearing (crank and cassette tooth count), and wheel circumference. But while the Peloton has a cadence sensor and a fixed wheel diameter, the resistance knob is not obviously controlling a continuously-variable transmission; instead it controls a magnetic brake. There are a few reasonable hypotheses for how speed could come out of the measurements we have at hand:
- Speed could be a function of resistance and cadence, with a linear relationship of cadence to speed.
- If the calculation follows the relationship of speed to drag losses, then we would expect speed to be approximately linear in power at low speed (dominated by driveline and ground friction) and proportional to the square root of power at higher speed (air drag).
- If the resistance knob is modeled as changing “slope” of the ground, then there should be a term related to the weight of the rider (a parameter input on the tablet), as increased weight implies increased power at the same speed if riding on any incline.
Cadence, Power, Speed: the Data
To get the data to answer these questions, I turned to two sources. The main source was Christian Bird‘s Peloton Data Downloader utility, which uses the Peloton API to download all of your own ride data. In order to check the last hypothesis, focused on rider weight, I browsed the rides of a friend who is significantly larger and (presumably…hopefully…) heavier than me and grabbed a few power/data traces from the Peloton web UI.
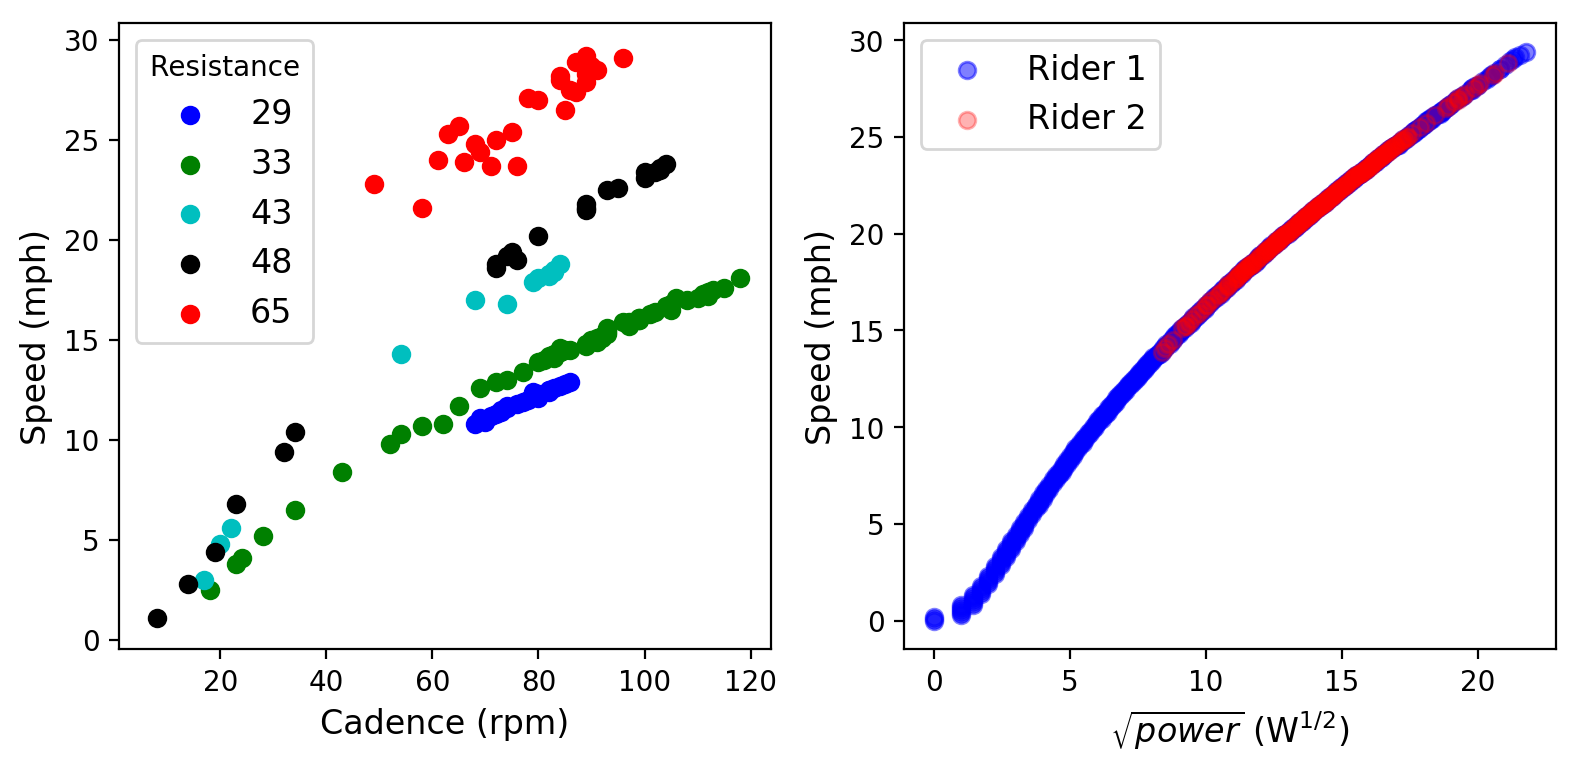
Right: Indicated speed as a function of power, for two riders of different weights
The above figure is sufficient to explore all three hypotheses. In the left panel, I’ve plotted the indicated speed as a function of cadence, with different resistance levels indicated in different colors. If the resistance knob worked like bike gearing, we would expect each color to follow a straight line, with increasing slope as resistance goes up. This does not happen. Instead, we see that (1) speed increases nonlinearly, with noticeably decreasing slope as cadence increases and (2) that speed is not even monotonic with cadence. Especially at higher resistance levels, we see speed jump around quite a bit with indicated cadence.
On the right panel, I’ve plotted indicated speed versus the square root of power. This is already a better fit — speed is very nearly monotonic with power. The bulk of the graph rises like a line — indicating speed growing as power squared — but there is a steeply rising part at the left (low power/speed) where the trend appears to be almost linear in power. Furthermore, the data from the two different riders, who are of different weights, overlays perfectly, indicating that the Peloton computes speed as a pure function of power without regard to rider weight.
Unfortunately, there doesn’t seem to be an obvious “simple” functional form to this data. It’s not likely that this is bike-specific, since the data for the two riders overlays perfectly. It’s entirely likely that the implementation of speed on the Bike uses an arbitrarily calibrated function, and there’s no reason we can’t do the same.
Polynomial regression for speed
In the decoding speed section of the PeloMon repository, I’ve added code to do some simple functional regression on Peloton speed and power data. Since it’s clear that the dominant component of the data is well fit by a function of sqrt(power), with some early data perhaps fit better as a linear function of power, I chose to model this using third-order polynomials in sqrt(power); while we don’t expect much of a p^(3/2) component, it’s easy to fit one and see.
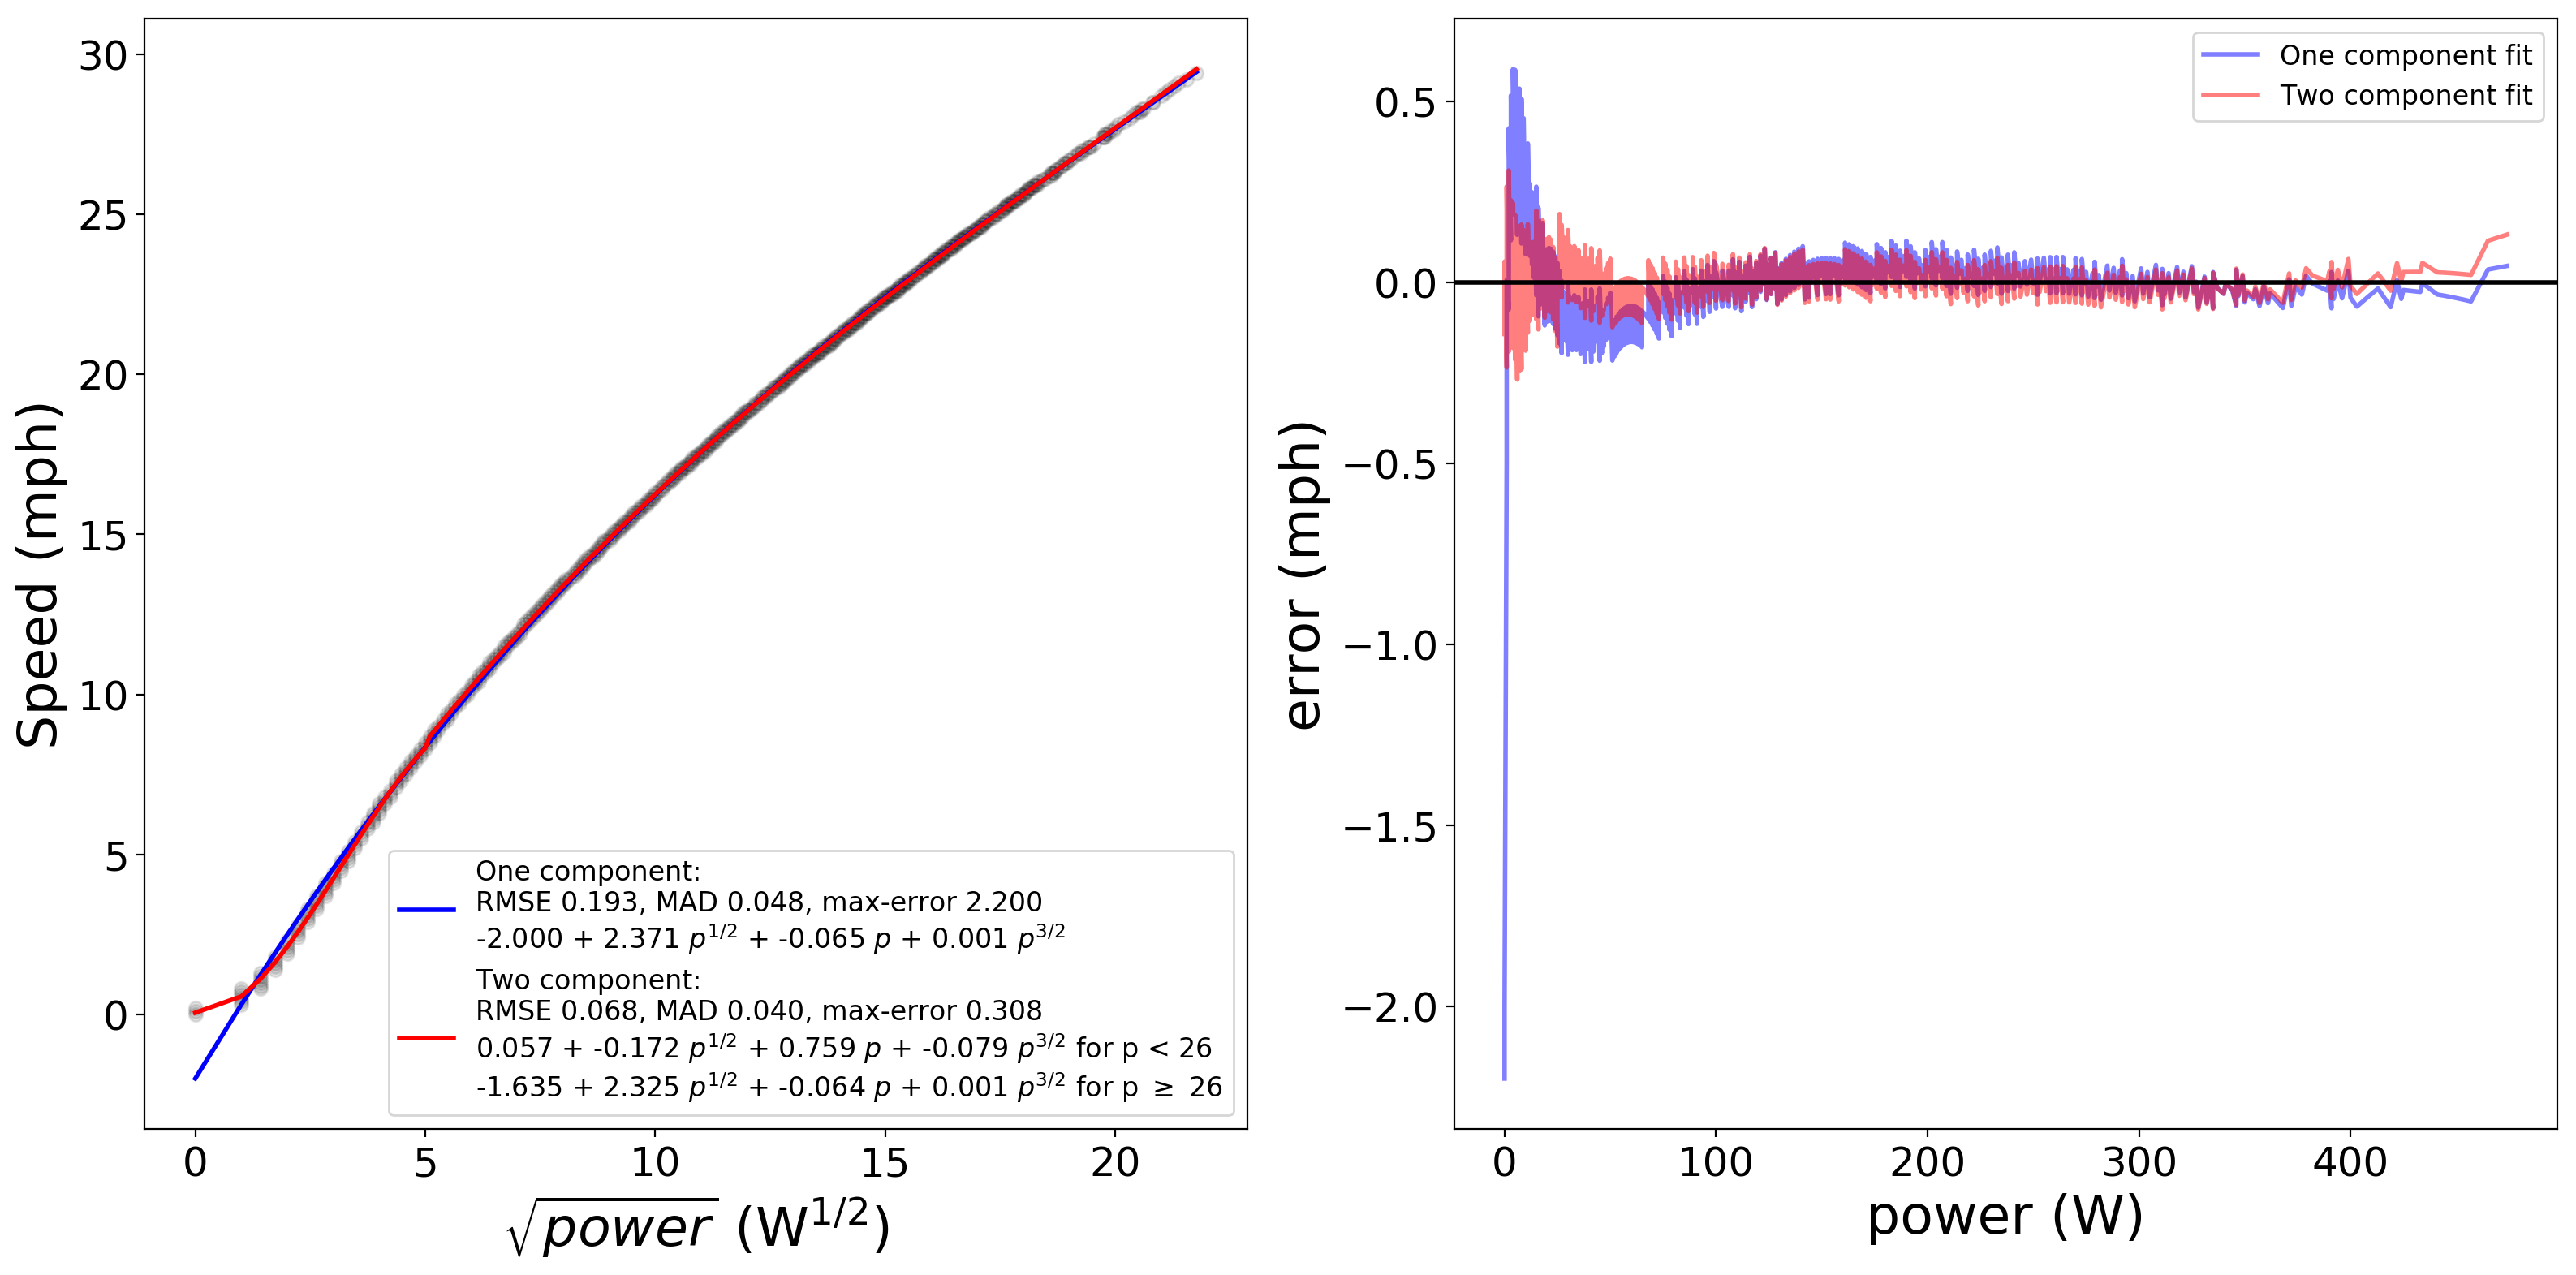
Right: Error in computed speed as a function of power from each fit
The above figure shows the results of fitting simple functions to the data. Fitting a single polynomial performs reasonably well over the bulk of the range, but has fairly large error at very slow speeds/low powers (under 30W). To get around this, I also fit a two-piece piecewise polynomial regression to the data, in which separate polynomials are fit to data above and below a threshold power level and the threshold is automatically chosen to minimize a chosen error condition. The two-component fit works nicely across the entire range from zero to around 450W, with a maximum absolute error of 0.3mph (at low power) and RMS error of 0.07mph, which is about as good as can be expected given that the Peloton only reports speed accurate to one decimal place. Notably, the coefficients of the two component fit also behave about as expected: the lower piece is dominated by a component that is linear in power whereas the upper piece (taking over at 26W) is dominated by a component proportional to the square root of power, and in both the third-order term is very small relative to the dominant term.
So in summary: the Peloton Bike computes speed as a function of power alone; rider weight is irrelevant, and cadence and resistance matter only insofar as they impact power. The following function computes speed S (in mph) as a function of power P (in watts) with reasonable accuracy over the range 0-450W:
Let r = sqrt(P).
For P < 26, S = 0.057 - 0.172 r + 0.759 r^2 - 0.079 r^3
For P >= 26, S = -1.635 + 2.325 r - 0.064 r^2 + 0.001 r^3
Questions? Comments? Drop me a line on Twitter and tag it #pelomon!