2019 Early Detection Mid-Year Roundup, Part II: Technology
Technology Directions to Address Tumor Fraction
Part of a series on advances in early detection liquid biopsy from 2019H1:
With the data I reviewed in the first post in the series it seems fair to say that everyone’s now agreed that tumor fraction is probably the major variable constraining ctDNA-based detection methods; now the question is what to do about it. In this post, I’ll review the technological methods and data presented by Grail and Guardant earlier this year to try to dodge these limitations. Both companies are interested in approaches going beyond sequence information alone to boost tumor fraction (examining the epigenetics of DNA methylation, fragment position, and fragment size), and Grail also published data on cell-free RNAs.
Epigenetics: Methylation
Methylation Assays
Methylation-based epigenetic information appears to be a big focus for both companies. Last year, Grail reported data that (on face) showed bisulfite sequencing to be similar in performance to both targeted sequencing (for mutations) and whole-genome sequencing (for global copy number analysis), but hinted that they’d be moving forward with bisulfite because of promise that they saw. This year they stated that whole-genome bisulfite sequencing performed about as well as targeted sequencing with a white-blood-cell-sequencing step to suppress variants from clonal hematopoiesis, that both of those outperformed targeted sequencing without CH suppression, and that all three outperformed WGS for global copy number analysis (1). Furthermore, they revealed without details that their new assay used in the second cohort of CCGA is a targeted, rather than whole-genome, bisulfite sequencing assay (1). This looks from the outside like a cost-cutting measure: running four expensive assays per samples (WGS, WGBS, targeted WBC, targeted cfDNA) was not a viable strategy for the number of samples targeted in CCGA and STRIVE, so they’re cutting down to the one that they think captures the benefits of the others. They did not disclose any details about the depth of sequencing nor about the size of the region of interest other than to say that “previous array-based studies captured <2% of genomic CpGs”, leaving unclear whether the targeted assay actually captures more than 2%, or if the >2% analyzed in previous 30x WGBS work was used to inform an even smaller targeted panel.
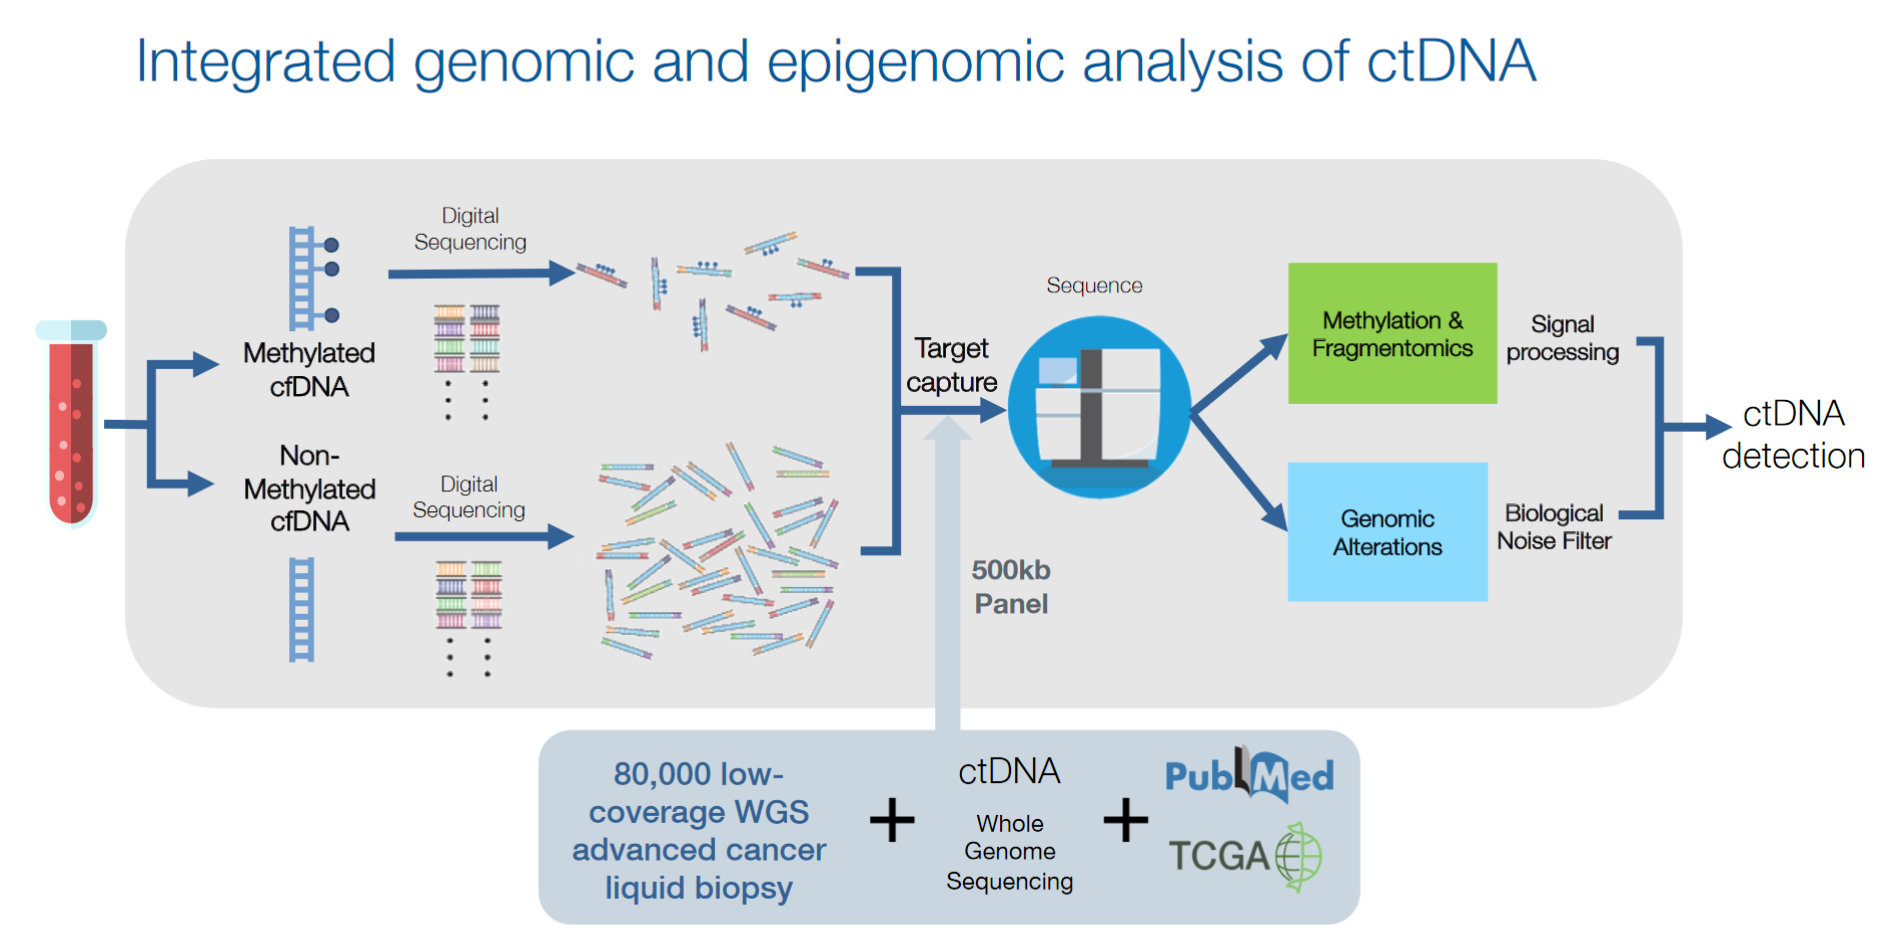
At AACR, Guardant disclosed an assay making use of methylation information for cancer detection as part of their LUNAR project (2). No details were given about the assay other than the slide shown above. Taking the slide at face value suggests a very different methodology than Grail’s bisulfite sequencing approach: what appears to be drawn is a system in which methylated and non-methylated cfDNA molecules are first separated from each other into individual pools, which are then separately captured and sequenced. Such an approach could be implemented (for example) by immunoprecipitation pulldown of methylated DNA followed by elution (methylated fragments in eluate, unmethylated fragments in original supernatant), or by splitting the original pool in two and using methylation-specific restriction enzymes to selectively digest away methylated fragments in one pool (leaving an unenriched and a depleted pool). However, no details are given on how this method is implemented, nor if this is even the right track (for example, you could also imagine doing this in silico by bisulfite sequencing followed by computational separation of methylated and unmethylated reads). Assuming a non-bisulfite pulldown-based method, though, this would have the advantage of ditching the degradative, material-hungry bisulfite treatment step at the cost of lower resolution of methylation: fragment-level separation rather than base-level readout. Either way, the slide is clear that Guardant’s is a targeted approach (with an ROI size of 500kbp), so both groups have converged away from whole-genome methodologies.
Methylation Analysis
Guardant offered very little information about their analysis of methylation data and what they did touches on the next topic of cfDNA fragmentation, so I’ll cover it there.
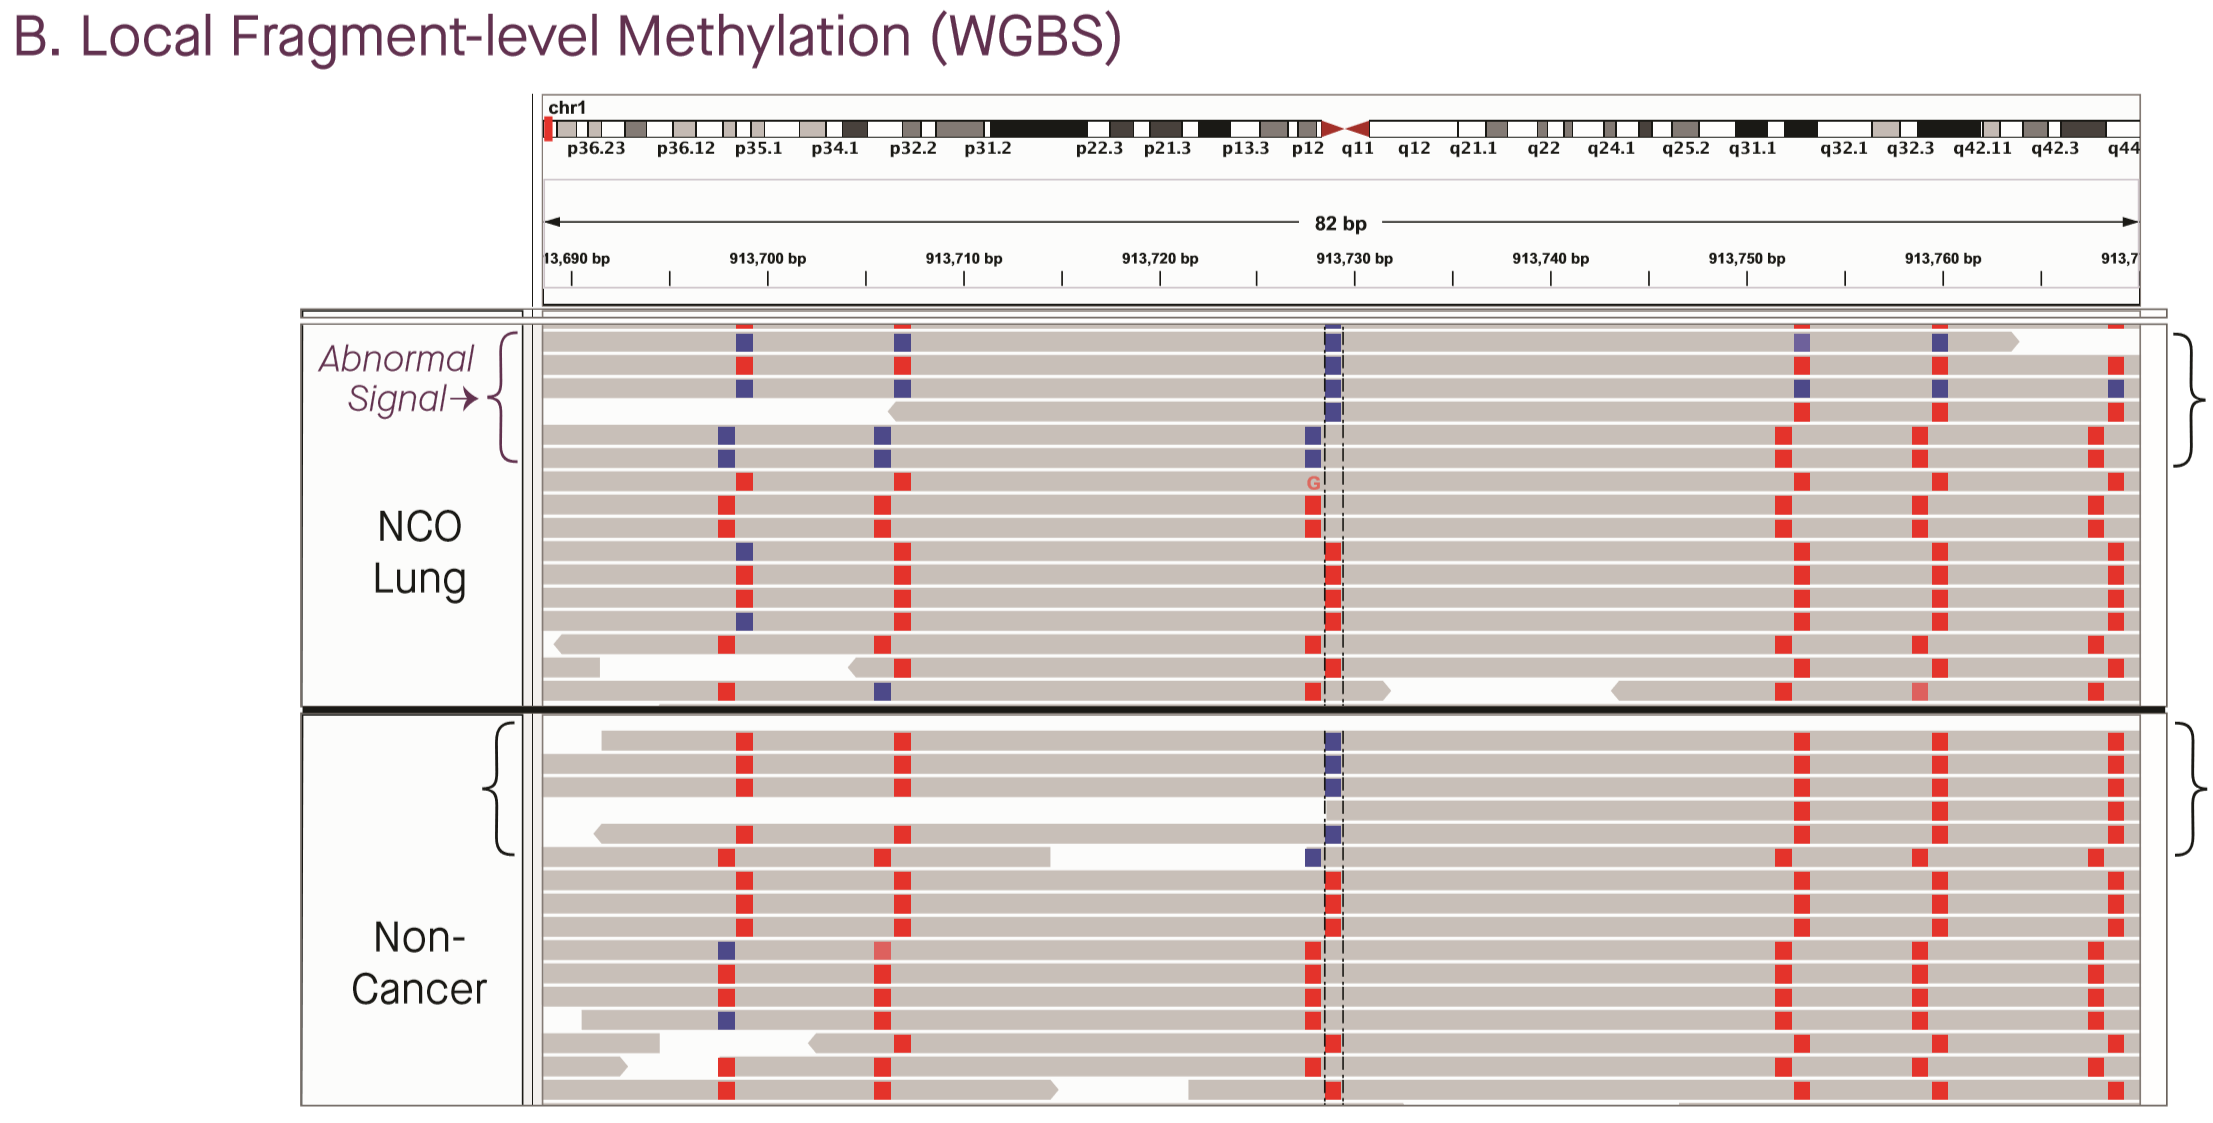
Grail provided somewhat more detail, though very vaguely phrased. The Cohn et al poster, covering analysis from the CCGA1 cohort and the original WGBS assay, stated that cancer-like signal comprised “multiple unusually methylated or unmethylated locations within molecules across the genome”, and provided IGV screenshots of a handful of loci in cancer cases discovered on followup (3). The above figure showed unusual hypomethylation in a patient with metastatic lung cancer. (Fun fact: if you look up the coordinates in UCSC, it looks like Grail is still on hg19…)
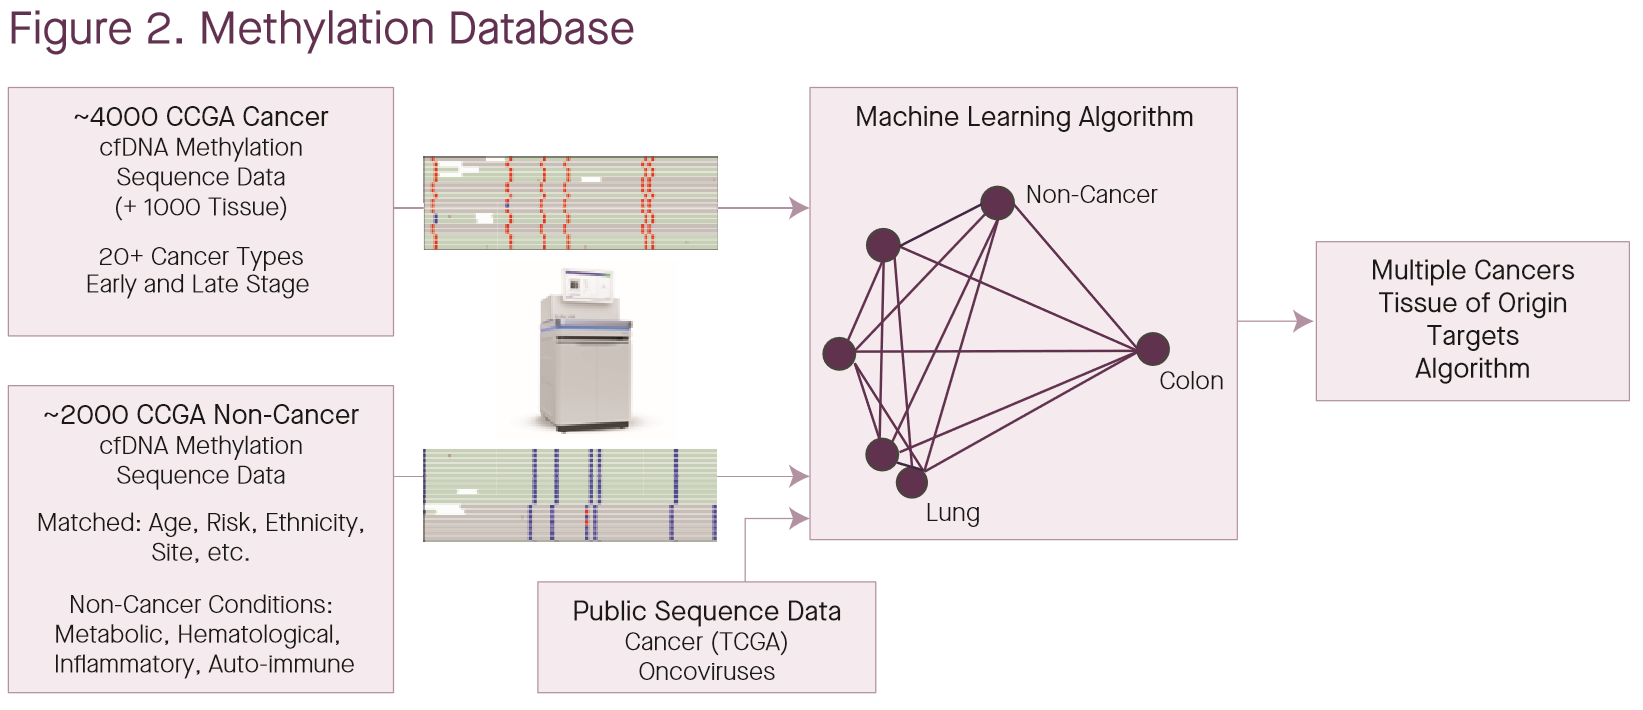
The poster discussing results from the targeted bisulfite assay used in CCGA2 added more information as well as a new method, illustrated above (1). Briefly, they have built a bespoke database of tumor methylation information using FFPE tumor tissue as well as isolated tumor cells subjected to WGBS. They have also used data from ~6k samples collected from CCGA (4000 cancer cfDNA, 1000 cancer tissue, 2000 putative non-cancer), to build a mixture model over “fragment methylation states” (presumably using cross-validation). Notably, they do not clarify what such a methylation state might be: anything from methylation at particular bases, to correlated patterns and haplotypes might be fair game. The mixture models fitted are either binary (cancer vs non-cancer) or a multi-class model for tissue-of-origin; both models were evaluated with and without the boost from the side information in the methylation database. The database was also used to define sites for the targeted panel. Note that the figure does not make clear whether the CCGA samples were part of this database or not. The use of this database enables marginal increases in performance: 55.1% sensitivity to cancer with the additional information from the database vs 53.7% without. The poster also claims increases in the number of samples that returned a tissue-of-origin result or a correct TOO result, but this seems to be driven almost entirely by the total number of samples with a cancer call at all.
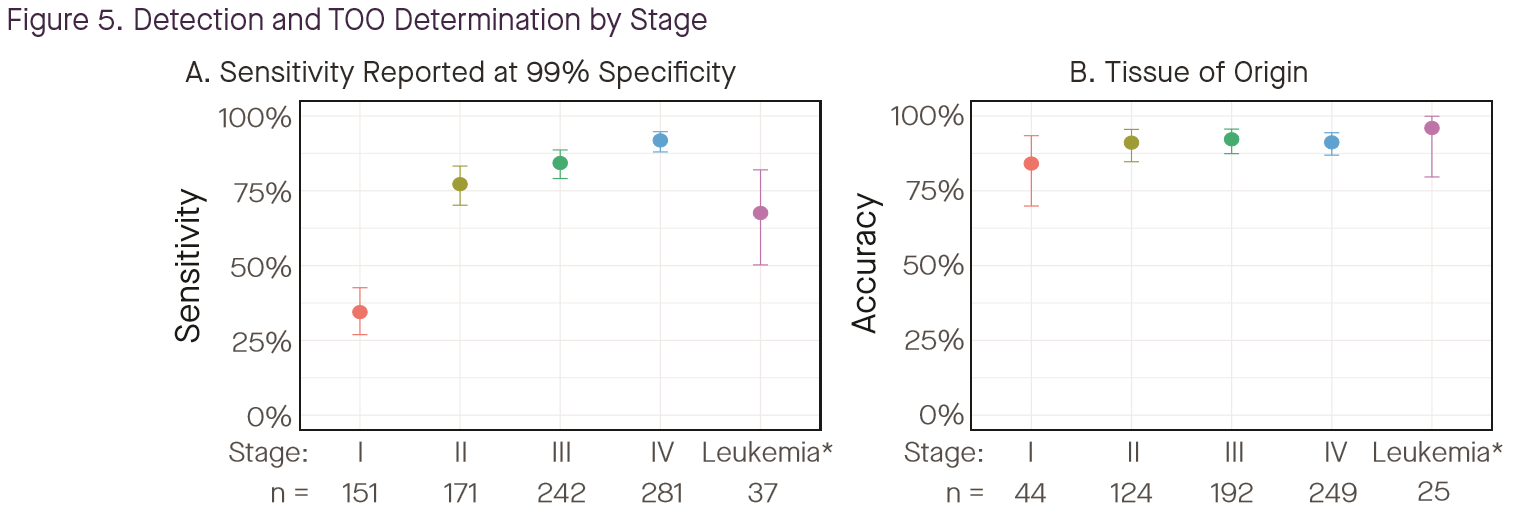
The above plot reported results on sensitivity and TOO accuracy by tumor stage; note that the denominator for the TOO plot is detected-cancers (so cancers that were missed in the left panel do not appear in the right panel). Summary: when the cancer is detected, TOO performance is generally high, but overall sensitivity remains a barrier in early stage.
Epigenetics: cfDNA fragmentation
An area of research dear to my own heart is the epigenetics of cfDNA fragmentation and positioning: cell-free DNA is not uniformly distributed across the genome, but rather is differentially sheared and located depending on gene expression, tissue of origin, epigenetic marks, chromatin organization, and a number of other unknown factors. Both Grail and Guardant discussed work leveraging this aspect of cfDNA biology, exploiting two different effects.
cfDNA fragment size
By now, it is well known that cfDNA fragments from a variety of solid tissues tend to be shorter the bulk of cfDNA derived from hematopoietic cells by 20-30bp (demonstrated in placental-derived cfDNA in pregnancy, transplant-derived cfDNA, and tumor-derived ctDNA). This effect enables a pair of analytical strategies discussed by Grail: suppression of CH-derived “tumor-like” variants, and enrichment of true tumor-derived variants.
Clonal hematopoiesis filtering
Last year at ASCO, Grail made a lot of noise claiming the necessity of doing matched white-blood cell targeted sequencing along with targeted sequencing of cfDNA in order to accurately filter mutations arising from clonal hematopoiesis (CH). However, the effect noted above offers another potential way to filter such mutations: CH-derived mutations should on average appear on longer fragments than mutations located on solid tumor-derived DNA. This year at ASCO Hubbell et al presented a poster examining this hypothesis (4).
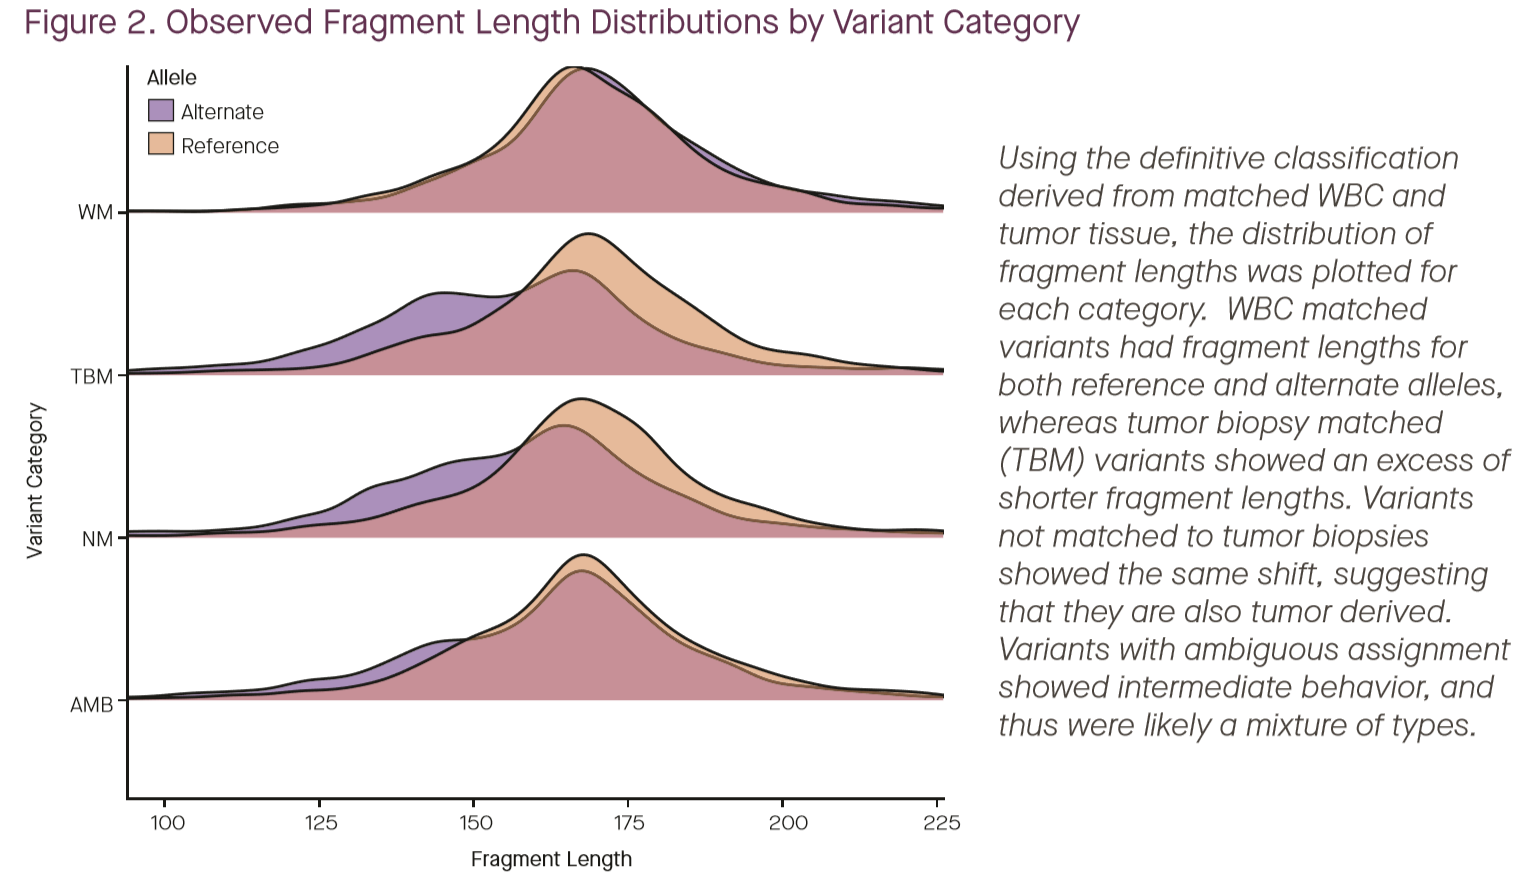
Hubbell et al separate mutations observed in WBCs (“WM”) from those observed in both cfDNA and tumor biopsy (“TBM”), those seen in cfDNA but not likely from WBCs (“NM”), and ambiguous variants (“AMB”). The plot above shows the size distributions of fragments carrying these different mutation classes, displaying the classic size shift from solid-tissue derived fragments (4).
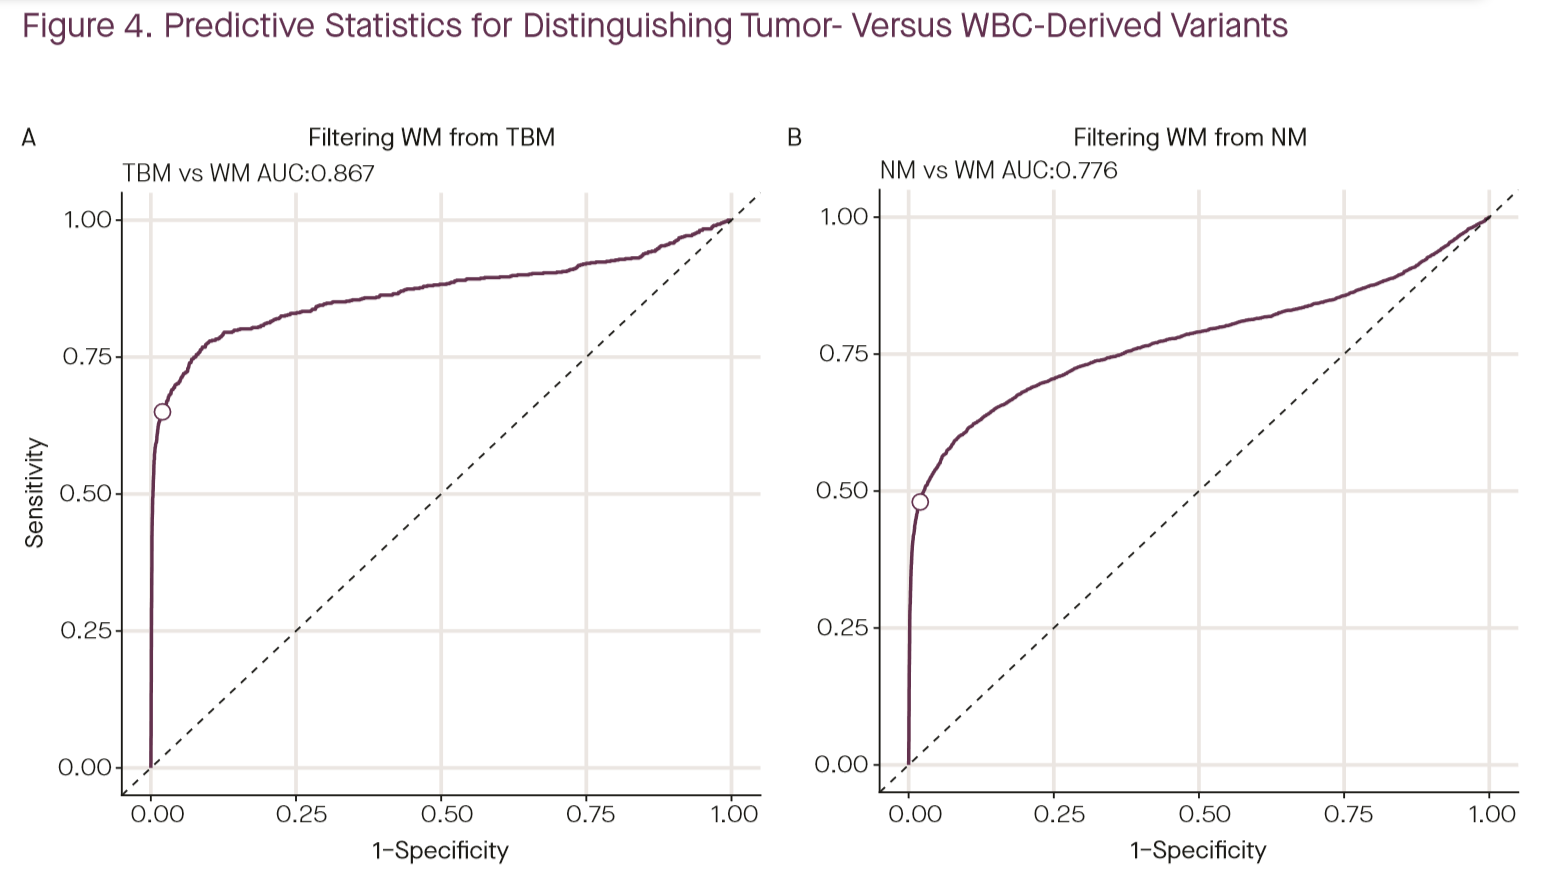
The authors then build a statistical model to separate tumor-derived and blood-derived variants from each other using length alone, and find an AUC of 0.867 in separating tumor-matched from WBC-derived variants, concluding that source prediction based on fragment length is less robust than matched-WBC sequencing (ROC plot shown above) (4). While this is likely true, I’m not convinced that it’s the last word on using fragment size information. The model explored here used only size, not variant location or identity, as the feature for classification. Given that there are known biases in mutations observed in CH and in fragmentation from gene expression and tissue of origin, I suspect that a model making using of not only size, but also position and variant identity could perform significantly better. Additionally, it is worth noting that the specificity analyzed in the poster is on the per-variant scale, not the per-patient scale, so the actual impact on clinical specificity is unclear. Nevertheless, for Grail’s purposes, this appears to be moot. As mentioned above, the company has decided that bisulfite sequencing offers the specificity advantages of matched WBC sequencing in a single sequencing reaction (likely by using methylation to drive tissue of origin inference), and they’re moving away from plain targeted sequencing towards targeted bisulfite sequencing of plasma alone (1).
Tumor fraction enrichment
Rather than using size information to deplete false positives, it’s also possible to use size information to enrich true positives. In an ASCO poster, Filippova et al explore first an in silico experiment to enrich tumor fraction by selecting only short fragments, and then an in vitro experiment to physically size-select samples before sequencing to measure the impact on tumor fraction (5).
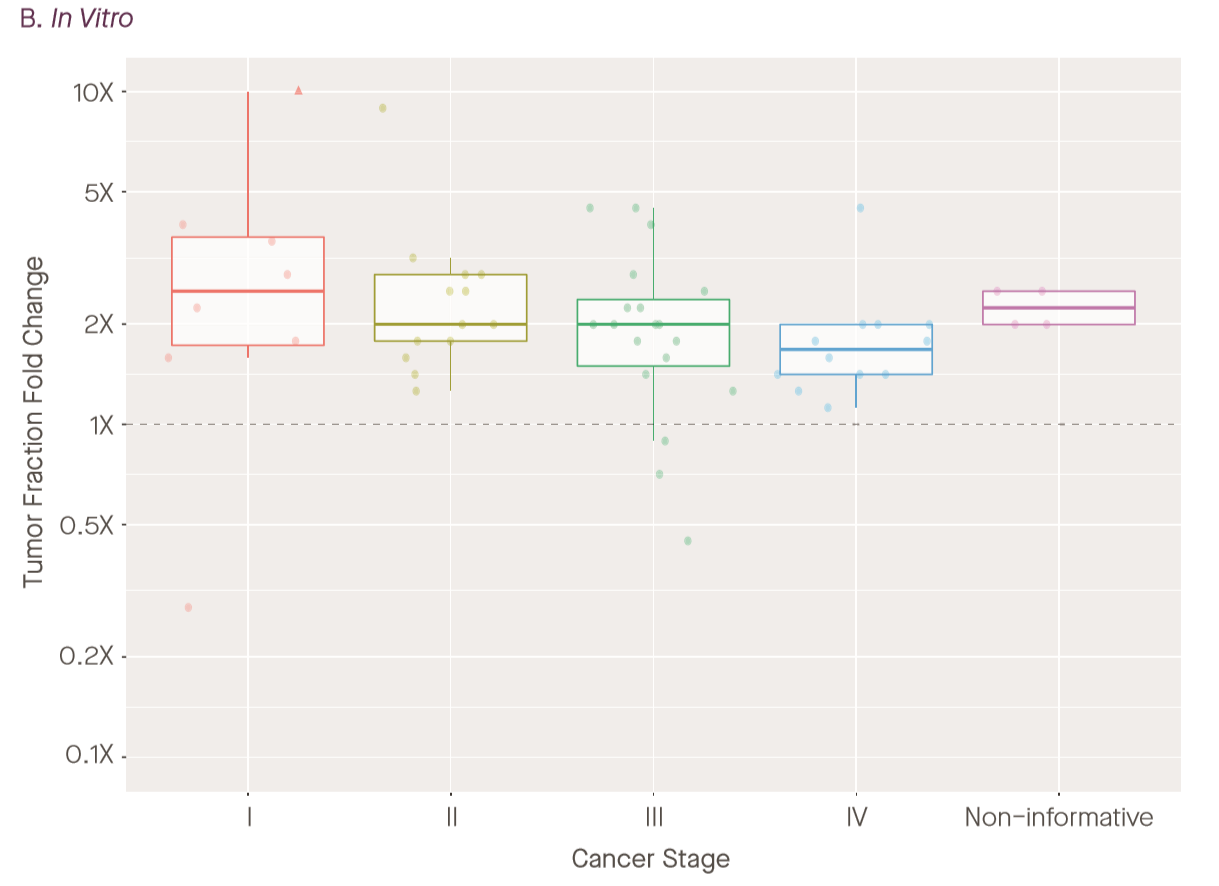
Long story short: this works, and they’re able to enrich tumor fraction by about 2-fold on average. It is not clear to me to what extent this helps in the limiting early-stage case where TF is extremely low and you either have very few molecules in the tube at all, but it may help get samples at 0.5% TF or higher over the seemingly-magic ~1% threshold for detection. However, it’s hard to tell from this plot: the right plot to determine this would be a scatter of original tumor fraction vs enriched tumor fraction; as presented, the enrichment may only be coming from cases with already high-tumor fraction. (For example, how is enrichment computed for samples with extremely low or zero observed TF?)
cfDNA fragment position
As I mentioned above, there’s interesting information in not only the size of cfDNA fragments, but also in where they are located in the genome. For example, it’s well known that cfDNA fragments tend to be depleted in the promoter/TSS regions of highly-expressed genes because the nucleosomes protecting them from degradation have to be moved away to enable transcription. Guardant recently acquired Bellwether Bio, the spinout from one of the papers mentioned in the last sentence, which was focused on using this fragmentation information to drive biomarker discovery. In their AACR presentation, Guardant discussed using the combination of (fragment-level?) methylation information and position information to drive cancer discovery (2).
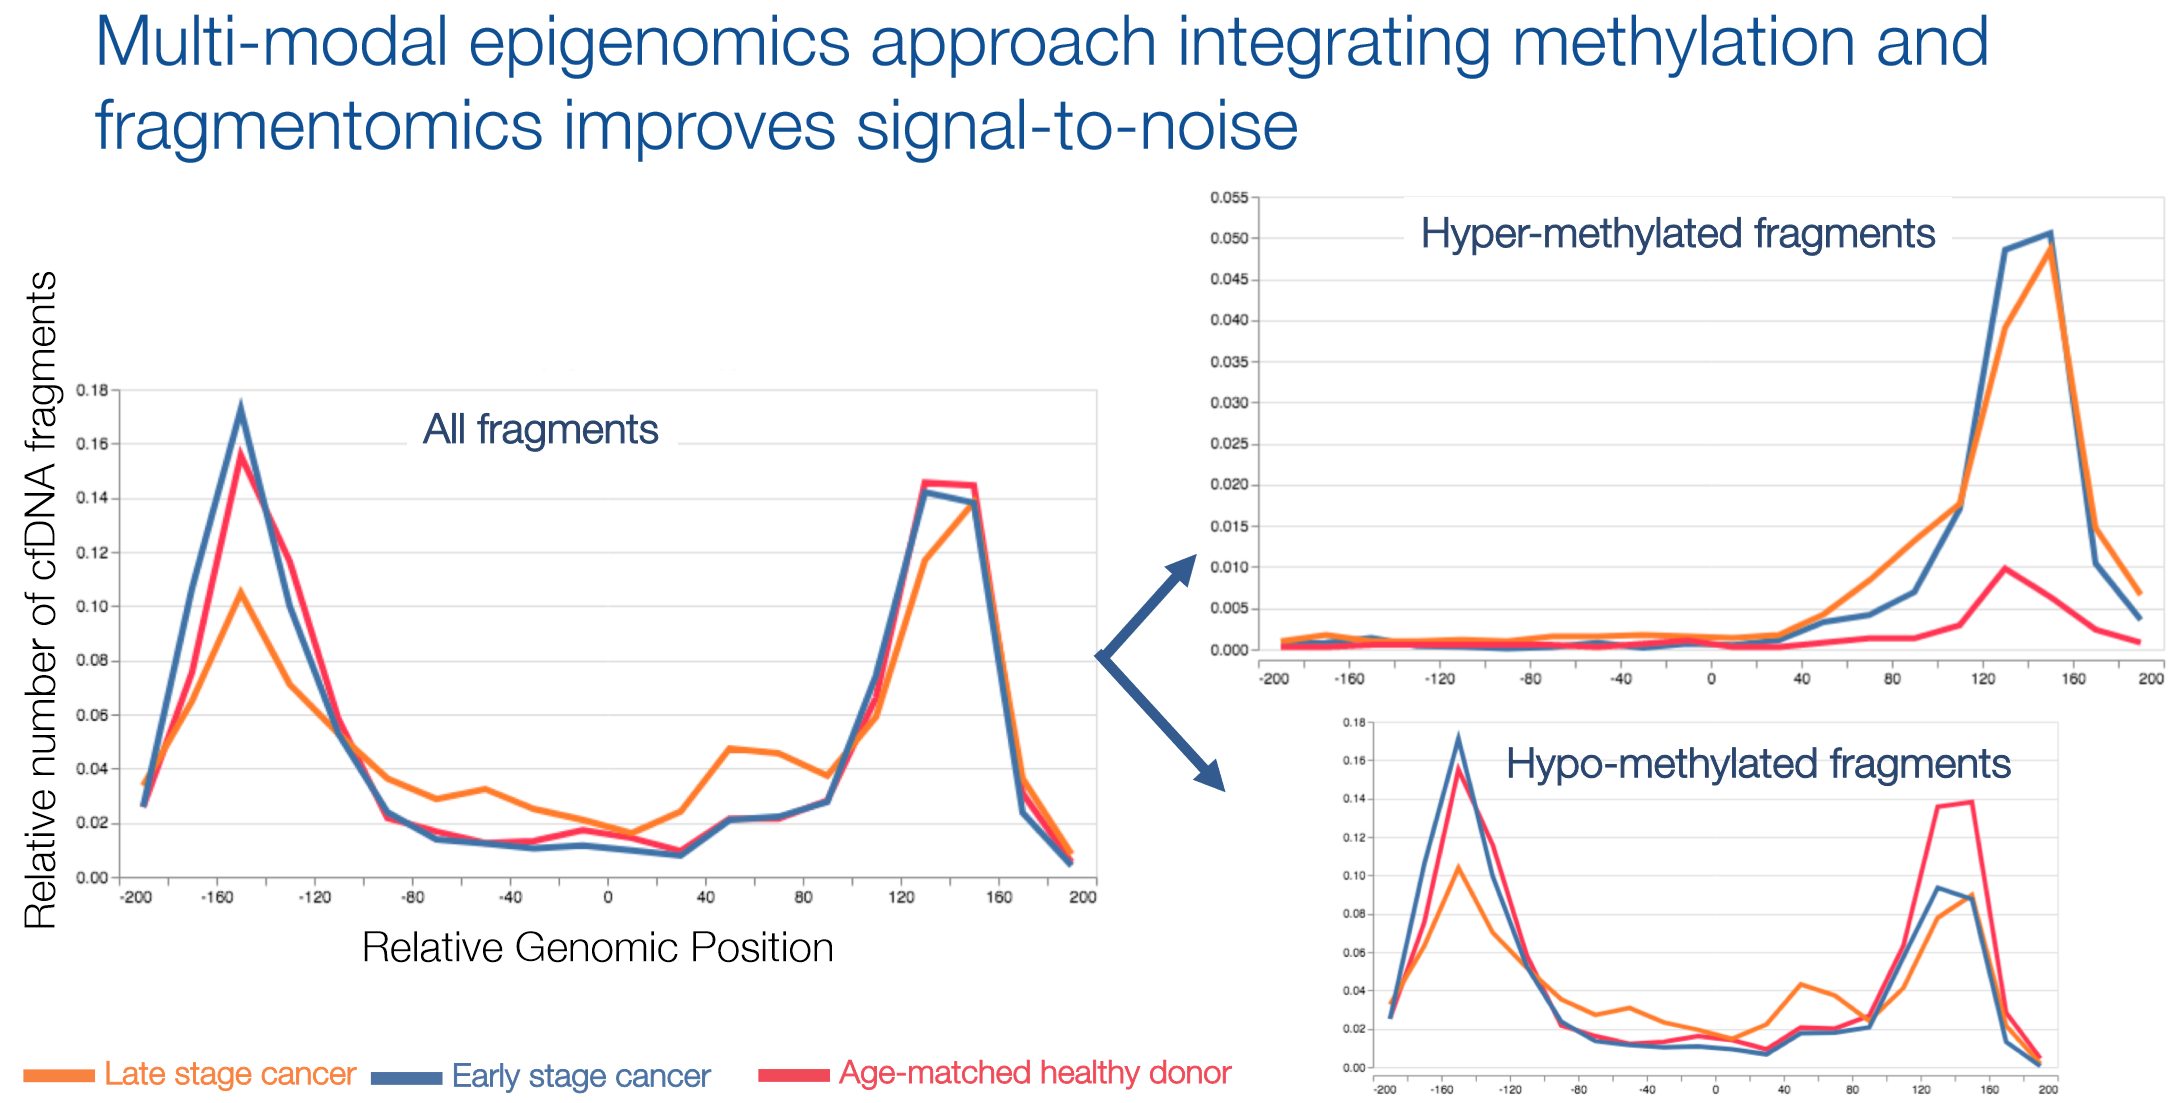
Details were sparse to nonexistent on how this is done, but the above slide offers some hints. The plot on the left shows the pattern I mentioned above: depression of sequencing depth in the vicinity of the transcription start site because of nucleosomal deprotection, with depth peaks at +/-160bp, give or take, the typical spacing between nucleosomes. The same pattern is observed in healthy patients as well as early and late stage cancers. Splitting the reads into hyper- and hypo-methylated fragments starts showing some differences. Both early- and late-stage cancers showed enrichment of the peak at +160bp from the TSS in the hypermethylated partition; late-stage cancers showed some depletion of the -160bp peak in the hypomethylated partition. This plot has to be taken with a lot of salt, obviously: this is only one sample from each category, and I strongly suspect that the “early-stage” sample chosen for the plot was in fact early-stage but high tumor fraction. Additionally, this is only one locus, and we have no information on how general this pattern is across loci, tumor types, or patients. More to come, I’m sure.
Cell-free RNAs
Capping off the technical developments, we got our first data from CCGA’s non-DNA arm this year. Grail had previously announced that they would do work on cell-free RNAs for cancer detection, and presented their first results at Biology of Genomes (6).
The poster from Larson and coauthors went into considerable detail about the study and assay design for this first look at Grail’s cfRNA work (6). The study examined 112 non-cancer-controls and 98 stage III cancer patients, and the poster explicitly states that stage III was chosen to a) maximize signal and b) minimize confounding from metastases - a very reasonable study design for an assay pilot experiment. cfRNAs were extracted, amplified using random hexamer primers, and depleted for high-abundance transcripts like rRNA, mtRNA, and blood transcripts (e.g., globins) - so this is essentially a whole-transcriptome experiment, not a targeted RNA experiment. (It’s worth noting that sample and library preps typically differ for full-length transcripts and short RNAs, so unless there’s more going on than mentioned, it’s likely that this picks up mRNAs but not miRNAs, and it’s unclear whether lncRNAs would be picked up.) Sequencing was fairly deep: 750M PE reads per sample. DNA contamination was excluded by only keeping read pairs that overlapped an exon-exon junction indicating splicing (this will certainly exclude miRNAs and other unspliced RNA species).
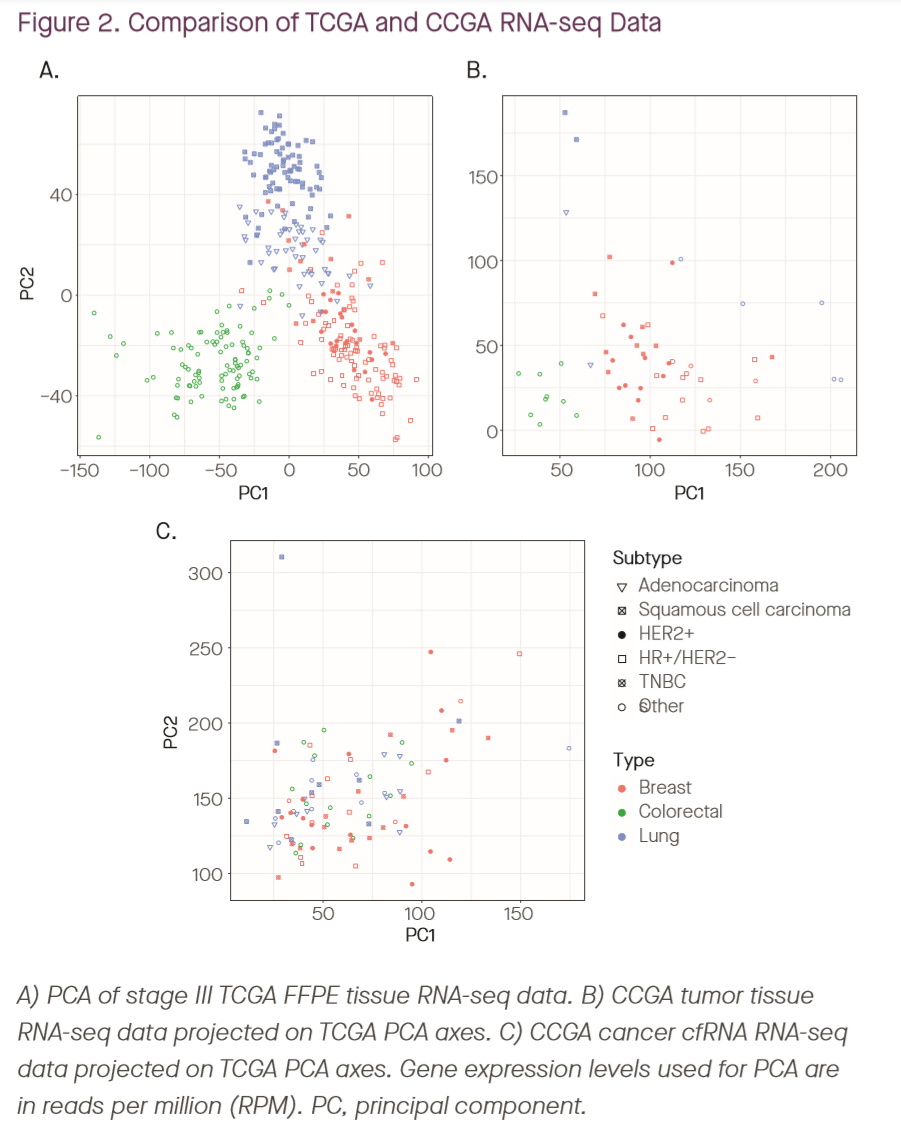
The above plot shows the distribution of transcript coverage from cfRNA vs tumor. Panel A shows a PCA of RNA-seq from TCGA tumors, and panel B shows RNA-seq data from CCGA tumors projected onto these same axes; the similarity is used to demonstrate comparability between CCGA and TCGA tumor data. When cfRNA data is projected onto these same axes in panel C, the plots look very different, indicating that the distribution of transcripts in plasma (as is perhaps to be expected) is very different from that in tumor tissue, even in late-stage non-metastatic cancer patients. (Weirdly, the data plotted were normalized as RPM rather than RPKM, but for the purposes of this plot it shouldn’t matter.)
Because of this discordance, the Grail team was left in the position of doing essentially de novo biomarker discovery from their cfRNA data, selecting what they termed “dark channel biomarker” genes: those with median expression 0 in non-cancer cfRNA data, which were expressed in more than 1 person in the cancer cfRNA cohort, and which were upregulated in cancer. No such genes were found for colorectal or anorectal cancer, but a handful were found for breast and lung cancer, with some genes appearing to be subtype-specific in this small cohort.
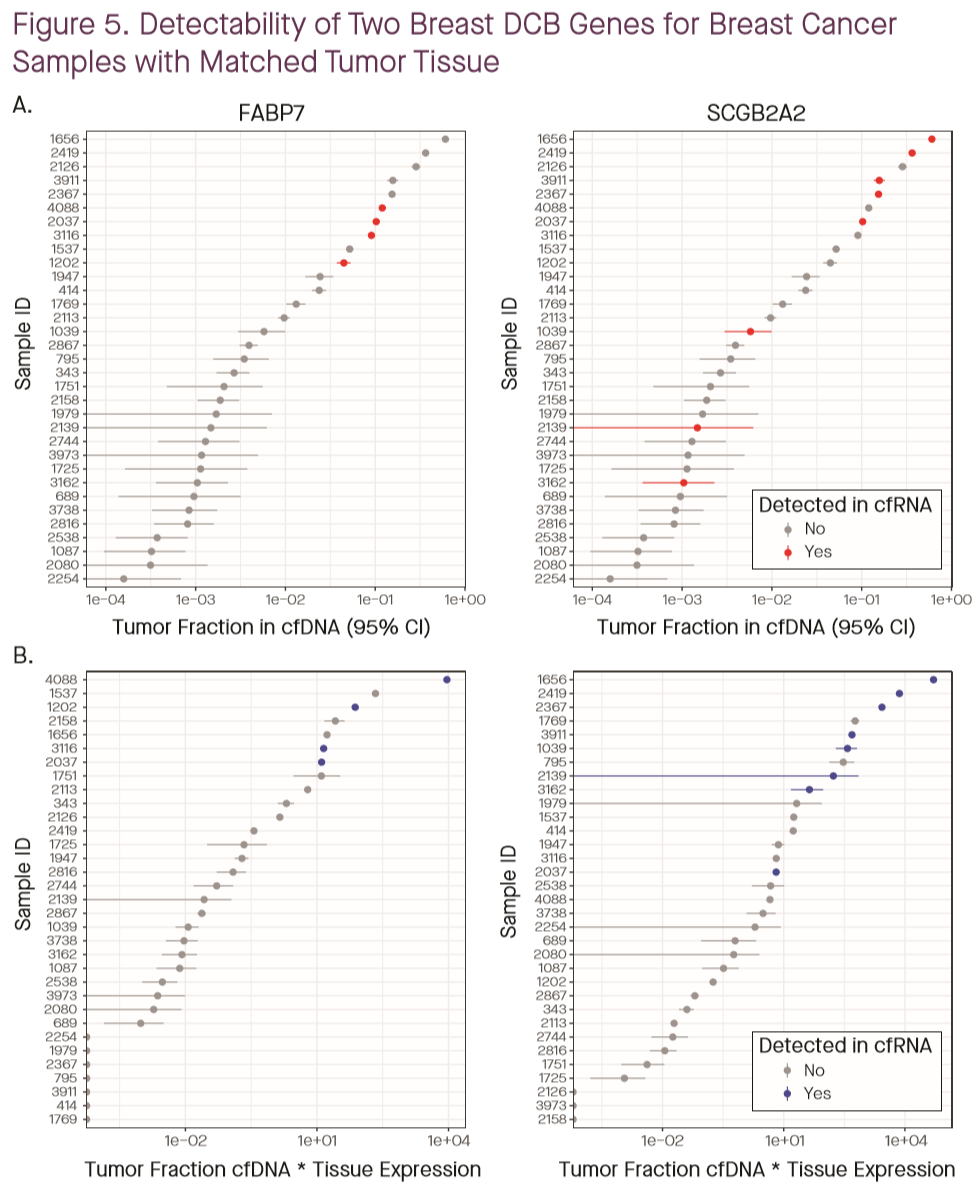
One goal of measuring cfRNA is to get around some of the limitations of tumor fraction: whereas similar processes that constrain cfDNA concentration likely also constrain cfRNA concentration, RNA is present at higher copy number than DNA, making it possible that it might be more easily detected. Larson et al compared the detectability in plasma of transcripts observed in tumor tissue, as a function of cfDNA tumor fraction (top row of plots above), and as a function of the product of tumor fraction and tissue expression level (bottom row). This showed good and bad news. On one hand, cfRNA detection was certainly biased by tumor fraction: 3/4 samples in which FABP7 was detected in plasma and 5/8 samples for SCGB2A2 had TF greater than 10%. On the other hand, the hypothesis that copy number matters also held up: all the samples below 10% TF in which those transcripts were picked up had particularly high expression levels of those genes. It remains to be seen whether or not this result will generalize to much lower tumor fraction levels, but it may give researchers another handle to look for signal.
Conclusions
The first half of the year has shown some interesting technical developments from both Grail and Guardant, with the focus shifting away from traditional cfDNA mutation detection towards epigenetic approaches incorporating methylation and fragmentation data, and the first non-DNA data from Grail. However, technical advances do not always translate into the clinic. In the next post in the series, I’ll take a closer look at the clinical sensitivity and specificity numbers reported by each company this year, and explore how this might impact the rollout of these technologies into the clinic.